| Param | Original file | Final file |
|---|---|---|
| Filename | modeM0/AS1A09_029T05_9000005124_35724cztM0_level2.evt | modeM0/AS1A09_029T05_9000005124_35724cztM0_level2_quad_clean.evt |
| Size (bytes) | 75,303,360 | 21,107,520 |
| Size | 71.8 MB | 20.1 MB |
| Events in quadrant A | 555,005 | 146,616 |
| Events in quadrant B | 493,742 | 147,237 |
| Events in quadrant C | 615,475 | 137,476 |
| Events in quadrant D | 549,733 | 134,993 |
| Mode SS | |||
|---|---|---|---|
| Quadrant | BADHDUFLAG | Total packets | Discarded packets |
| A | 0 | 18 | 0 |
| B | 0 | 18 | 0 |
| C | 0 | 18 | 0 |
| D | 0 | 18 | 0 |
| Mode M0 | |||
|---|---|---|---|
| Quadrant | BADHDUFLAG | Total packets | Discarded packets |
| A | 0 | 2218 | 2 |
| B | 0 | 1976 | 1 |
| C | 0 | 2362 | 1 |
| D | 0 | 2170 | 1 |
| Mode M9 | |||
|---|---|---|---|
| Quadrant | BADHDUFLAG | Total packets | Discarded packets |
| A | 0 | 15 | 0 |
| B | 0 | 15 | 0 |
| C | 0 | 15 | 0 |
| D | 0 | 15 | 0 |
| Quadrant | Total seconds | Saturated seconds | Saturation percentage |
|---|---|---|---|
| A | 934 | 3 | 0.321199% |
| B | 934 | 2 | 0.214133% |
| C | 934 | 37 | 3.961456% |
| D | 934 | 15 | 1.605996% |
Noise dominated data is calculated using 1-second bins in cleaned event files. If a bin has >2000 counts, and if more than 50% of those come from <1% of pixels, then it is considered to be noise-dominated and hence unusable.
| Quadrant | # 1 sec bins | Bins with >0 counts | Bins with >2000 counts | High rate bins dominated by noise | Noise dominated (total time) | Noise dominated (detector-on time) | Marked lightcurve |
|---|---|---|---|---|---|---|---|
| A | 934 | 934 | 0 | 0 | 0.00% | 0.00% | 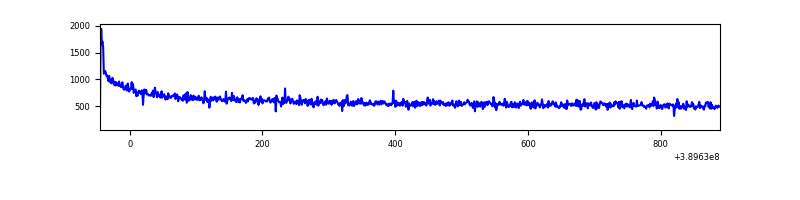 |
| B | 934 | 934 | 0 | 0 | 0.00% | 0.00% | 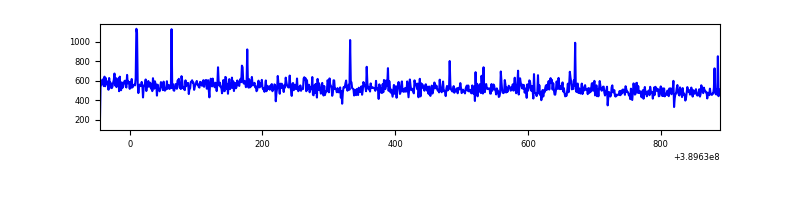 |
| C | 934 | 934 | 35 | 35 | 3.75% | 3.75% | 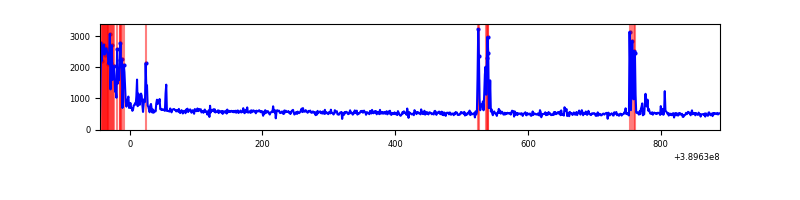 |
| D | 934 | 934 | 15 | 15 | 1.61% | 1.61% | 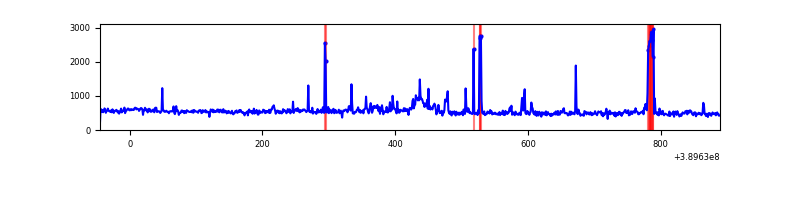 |
Top three noisy pixels from each quadrant. If the there are fewer than three noisy pixels in the level2.evt file, extra rows are filled as -1
| Pixel properties | Quadrant properties | ||||||
|---|---|---|---|---|---|---|---|
| Quadrant | DetID | PixID | Counts | Sigma | Mean | Median | Sigma |
| A | 10 | 83 | 55764 | 2006.88 | 127 | 125 | 27.7 |
| A | 10 | 67 | 2001 | 67.67 | 127 | 125 | 27.7 |
| A | 13 | 254 | 1600 | 53.2 | 127 | 125 | 27.7 |
| B | 0 | 197 | 5225 | 201.17 | 123 | 120 | 25.4 |
| B | 5 | 255 | 4644 | 178.27 | 123 | 120 | 25.4 |
| B | 12 | 111 | 2607 | 98.0 | 123 | 120 | 25.4 |
| C | 0 | 10 | 81812 | 2900.64 | 115 | 116 | 28.2 |
| C | 15 | 214 | 43673 | 1546.51 | 115 | 116 | 28.2 |
| C | 0 | 207 | 36280 | 1284.01 | 115 | 116 | 28.2 |
| D | 13 | 249 | 37631 | 1202.03 | 120 | 117 | 31.2 |
| D | 10 | 118 | 17656 | 561.99 | 120 | 117 | 31.2 |
| D | 10 | 199 | 9687 | 306.64 | 120 | 117 | 31.2 |
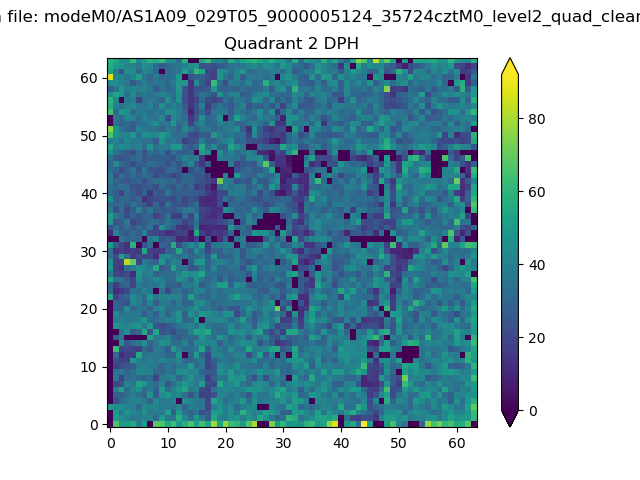
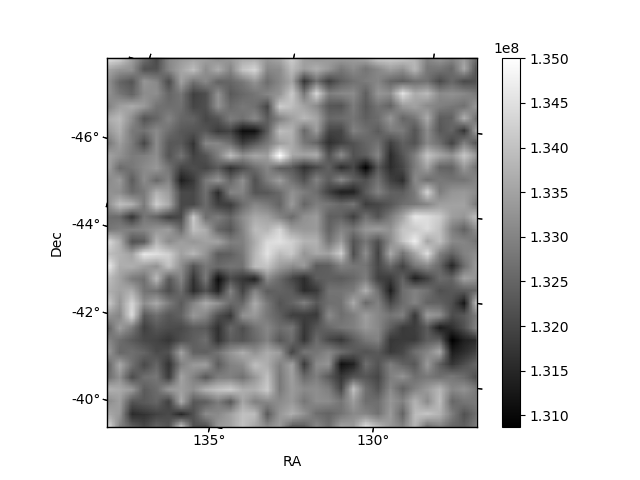
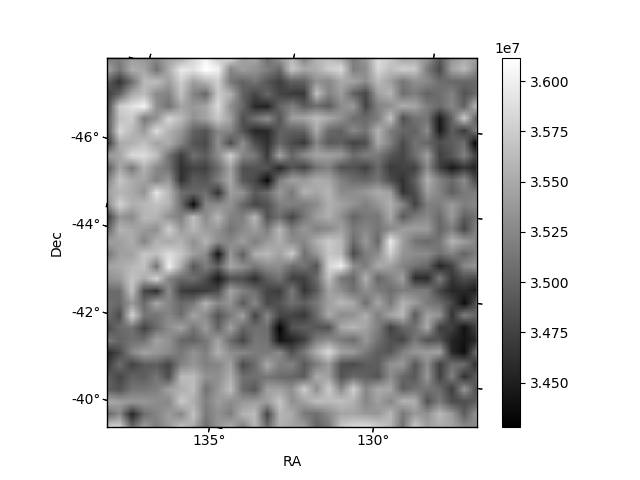
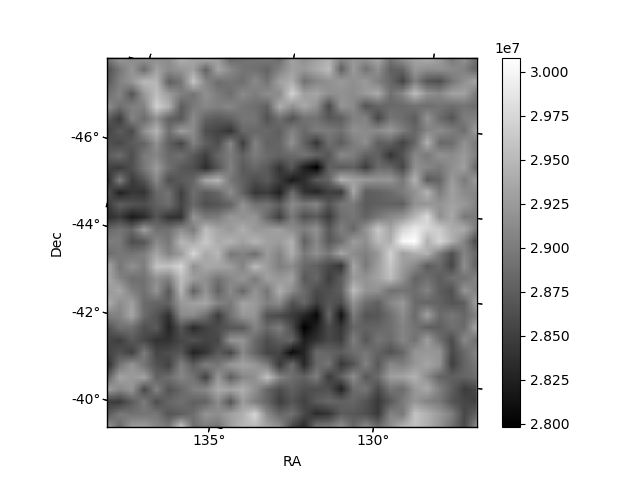
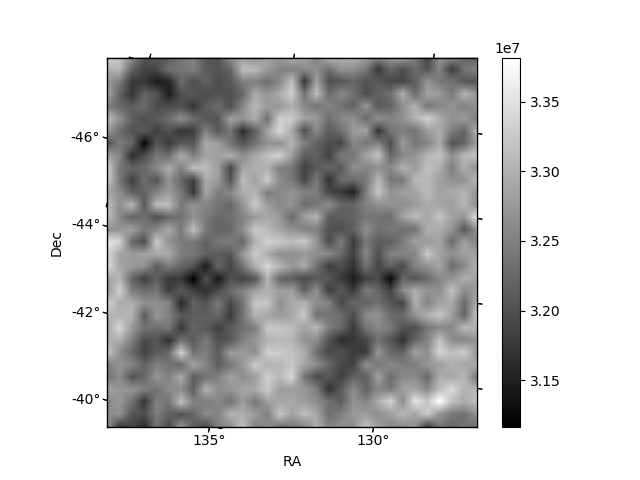
Histogram calculated using DETX and DETY for each event in the final _common_clean file
| Quadrant A | 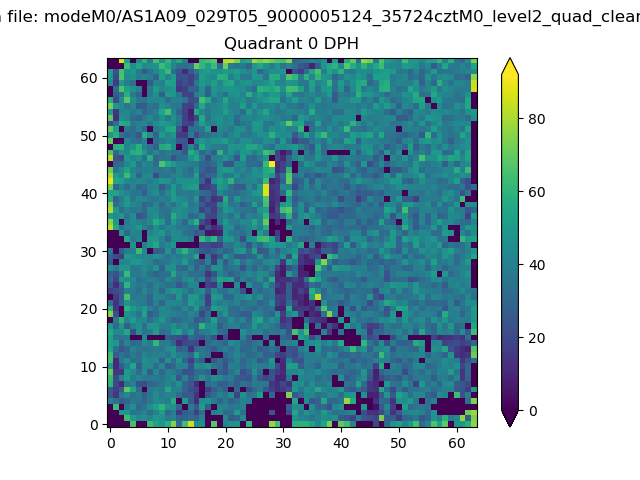 |
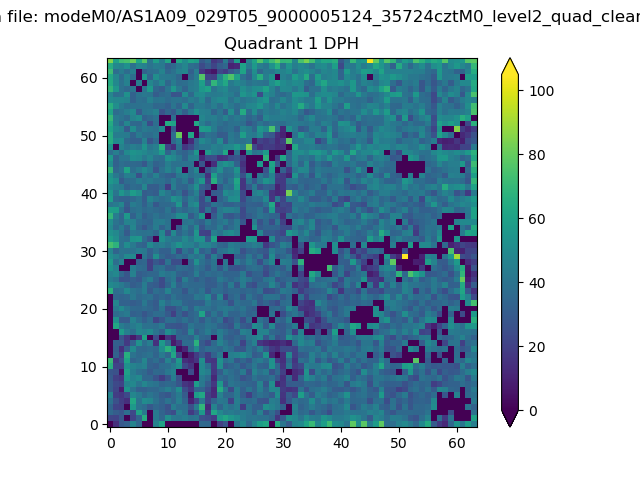 |
Quadrant B |
|---|---|---|---|
| Quadrant D | 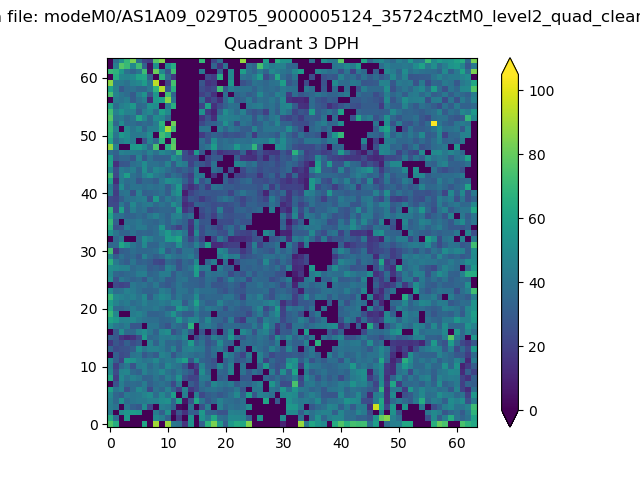 |
 |
Quadrant C |
| Plot type | Count rate plots | Images |
|---|---|---|
| Comparison with Poisson distribution Blue bars denote a histogram of data divided into 1 sec bins. Red curve is a Poisson curve with rate = median count rate of data. |
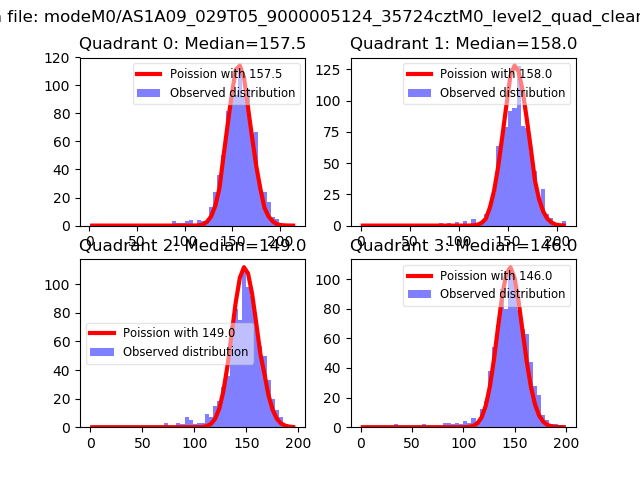 |
 |
| Quadrant-wise count rates Data is divided into 100 sec bins |
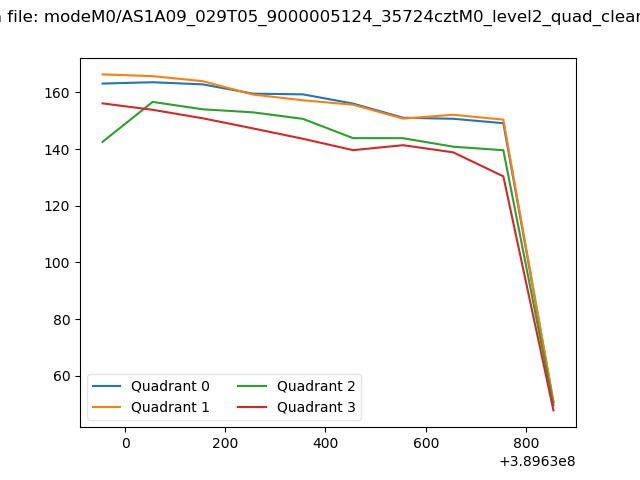 |
|
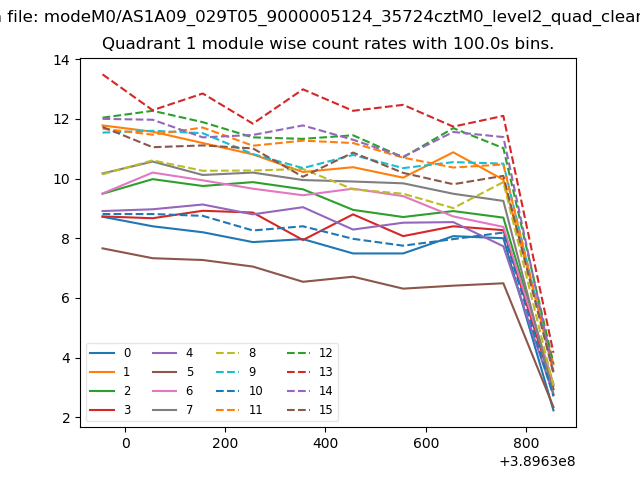
| Module-wise count rates for Quadrant A Data is divided into 100 sec bins |
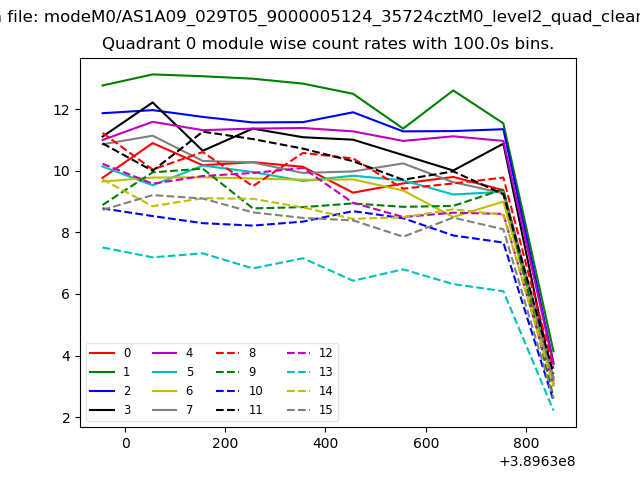 |
 |
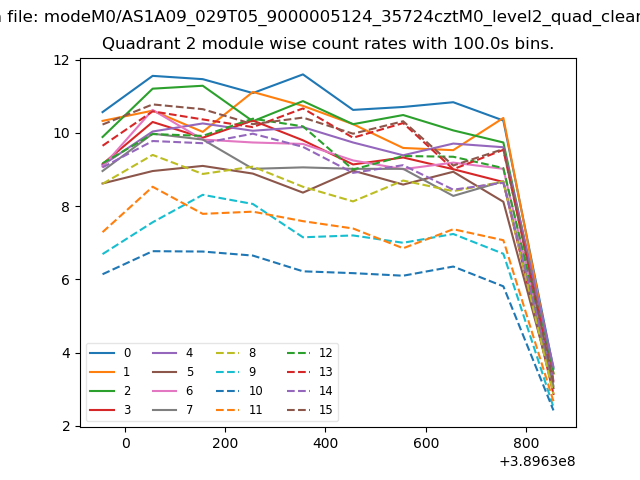
| Module-wise count rates for Quadrant B Data is divided into 100 sec bins |
 |
 |
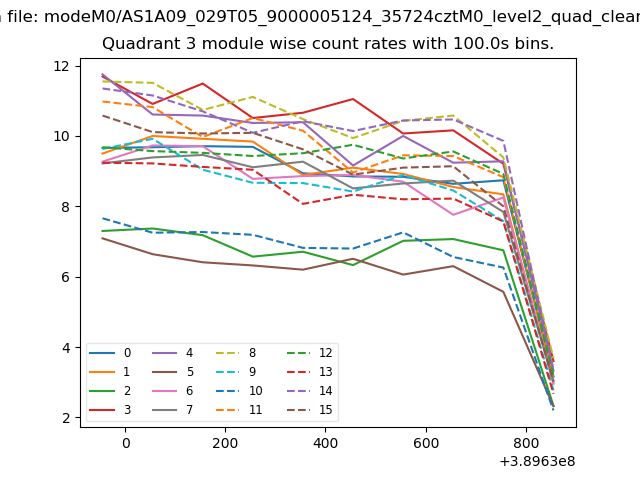
| Module-wise count rates for Quadrant C Data is divided into 100 sec bins |
 |
 |
| Module-wise count rates for Quadrant D Data is divided into 100 sec bins |
 |
 |
| Parameter | Plot |
|---|---|
| CZT HV Monitor | 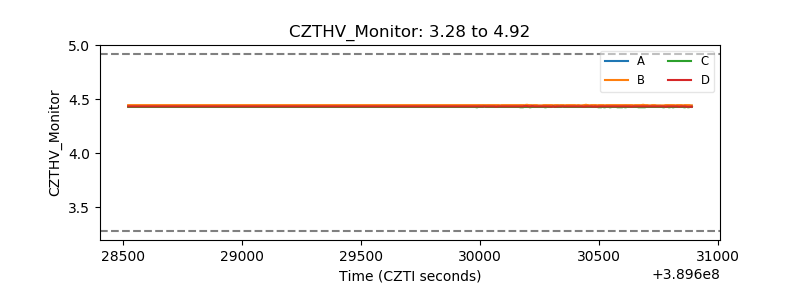 |
| D_VDD | 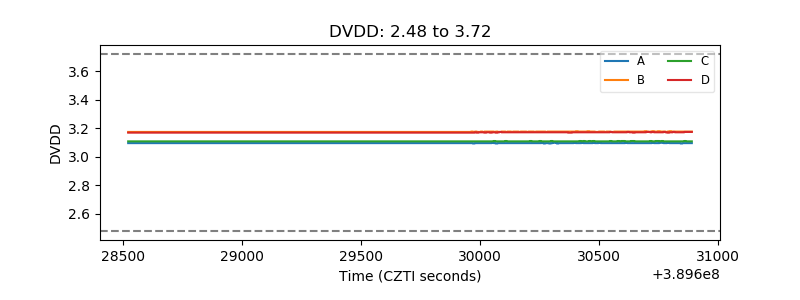 |
| Temperature 1 | 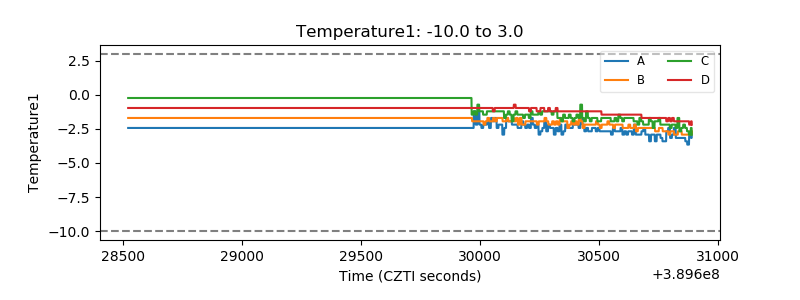 |
| Veto HV Monitor | 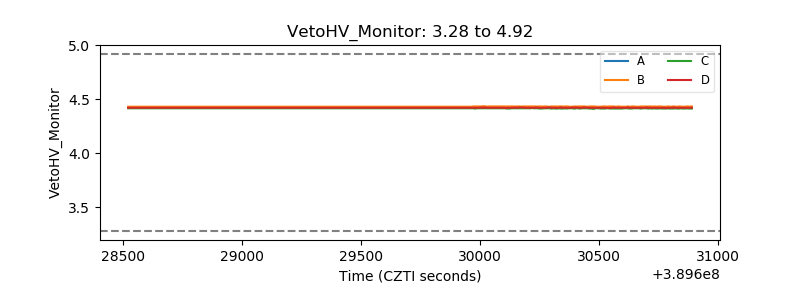 |
| Veto LLD | 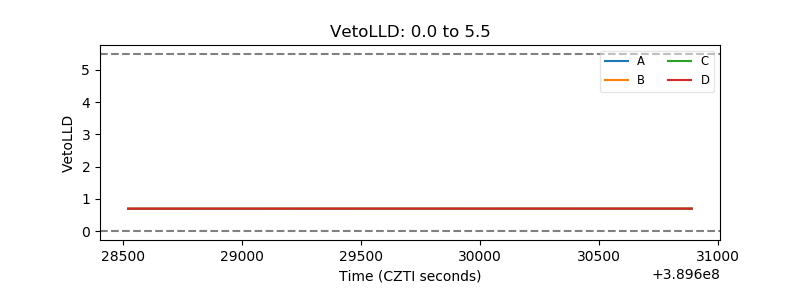 |
| Alpha Counter | 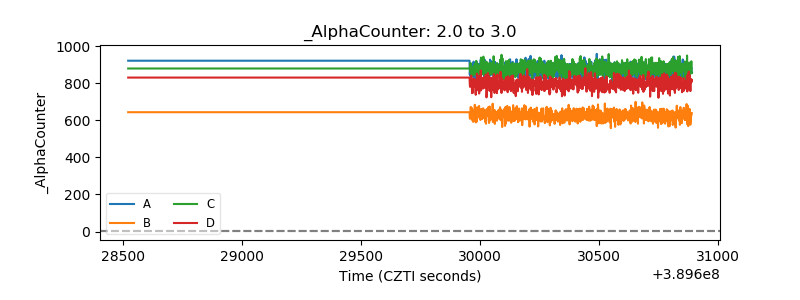 |
| _CPM_Rate | 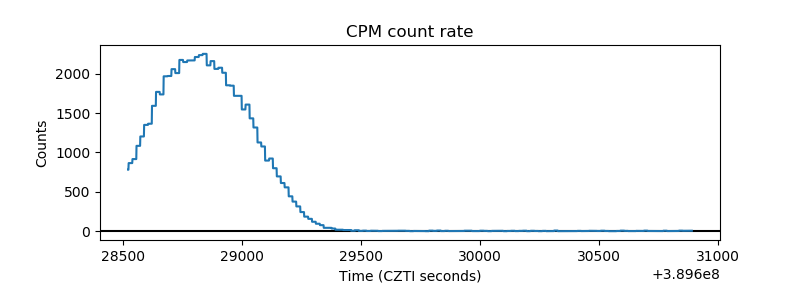 |
| CZT Counter | 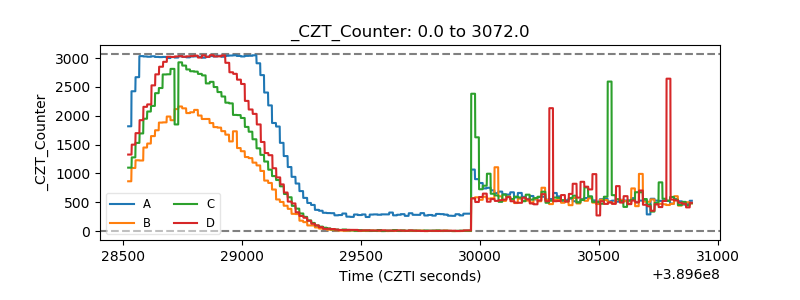 |
| +2.5 Volts monitor | 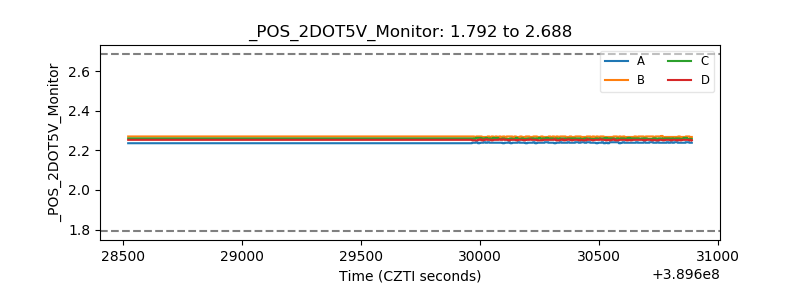 |
| +5 Volts monitor | 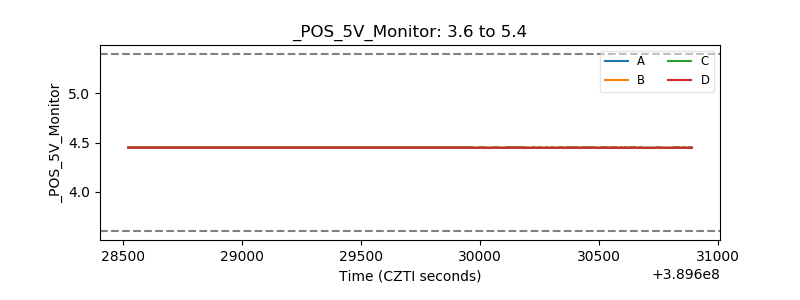 |
| _ROLL_ROT | 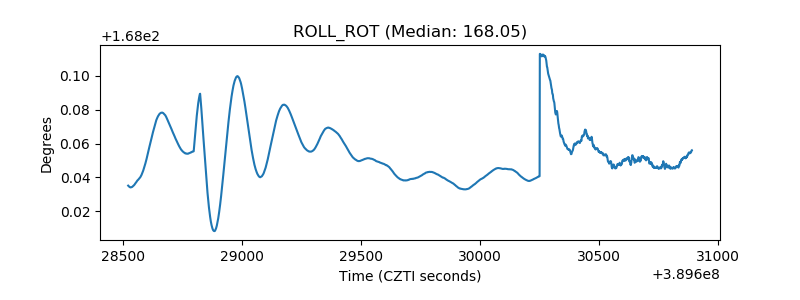 |
| _Roll_DEC | 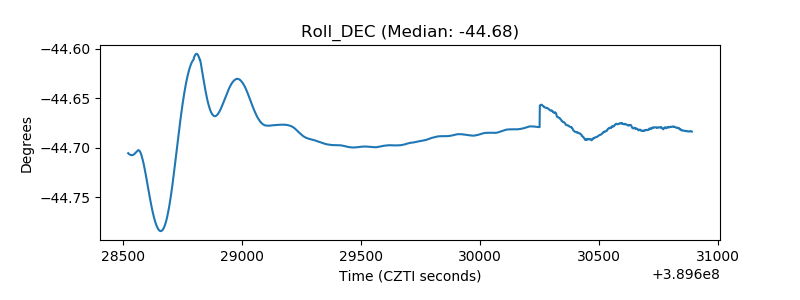 |
| _Roll_RA | 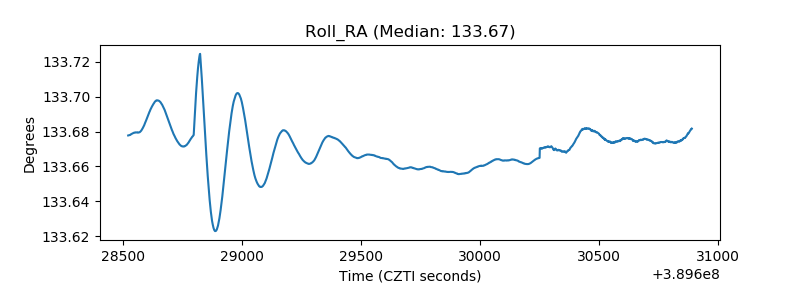 |
| Veto Counter | 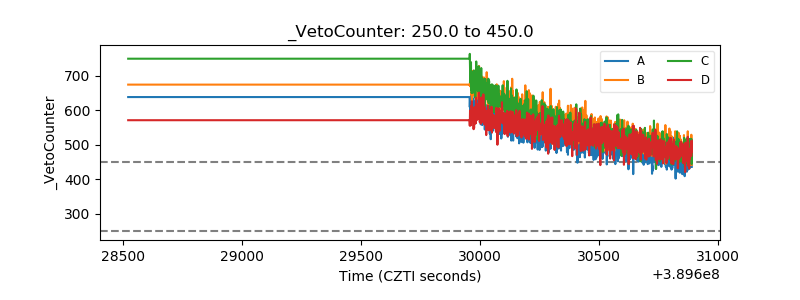 |