| Param | Original file | Final file |
|---|---|---|
| Filename | modeM0/AS1T05_057T01_9000005346cztM0_level2_bc.evt | modeM0/AS1T05_057T01_9000005346cztM0_level2_quad_clean.evt |
| Size (bytes) | 2,896,663,680 | 841,665,600 |
| Size | 2.7 GB | 802.7 MB |
| Events in quadrant A | 21,986,679 | 5,320,857 |
| Events in quadrant B | 17,645,614 | 5,406,693 |
| Events in quadrant C | 17,495,077 | 5,417,047 |
| Events in quadrant D | 26,284,626 | 4,998,162 |
| Mode M0 | |||
|---|---|---|---|
| Quadrant | BADHDUFLAG | Total packets | Discarded packets |
| A | 0 | 154895 | 0 |
| B | 0 | 145292 | 0 |
| C | 0 | 136784 | 0 |
| D | 0 | 174062 | 0 |
| Mode SS | |||
|---|---|---|---|
| Quadrant | BADHDUFLAG | Total packets | Discarded packets |
| A | 0 | 1298 | 0 |
| B | 0 | 1298 | 0 |
| C | 0 | 1298 | 0 |
| D | 0 | 1298 | 0 |
| Mode M9 | |||
|---|---|---|---|
| Quadrant | BADHDUFLAG | Total packets | Discarded packets |
| A | 0 | 257 | 0 |
| B | 0 | 257 | 0 |
| C | 0 | 257 | 0 |
| D | 0 | 257 | 0 |
| Quadrant | Total seconds | Saturated seconds | Saturation percentage |
|---|---|---|---|
| A | 63418 | 2221 | 3.502160% |
| B | 63418 | 931 | 1.468037% |
| C | 63418 | 425 | 0.670157% |
| D | 63418 | 2765 | 4.359961% |
Noise dominated data is calculated using 1-second bins in cleaned event files. If a bin has >2000 counts, and if more than 50% of those come from <1% of pixels, then it is considered to be noise-dominated and hence unusable.
| Quadrant | # 1 sec bins | Bins with >0 counts | Bins with >2000 counts | High rate bins dominated by noise | Noise dominated (total time) | Noise dominated (detector-on time) | Marked lightcurve |
|---|---|---|---|---|---|---|---|
| A | 87769 | 63428 | 870 | 870 | 0.99% | 1.37% | 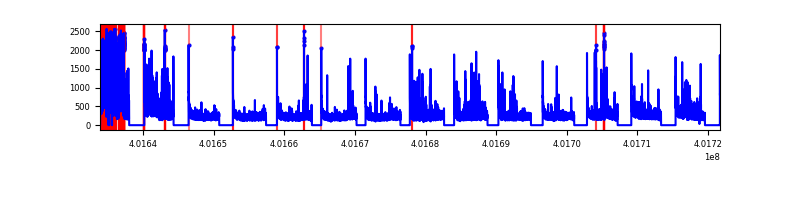 |
| B | 87768 | 63414 | 85 | 85 | 0.10% | 0.13% | 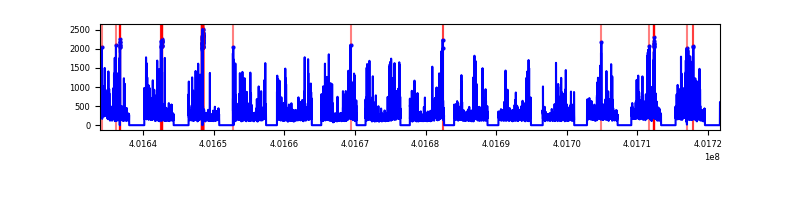 |
| C | 87768 | 63417 | 51 | 51 | 0.06% | 0.08% | 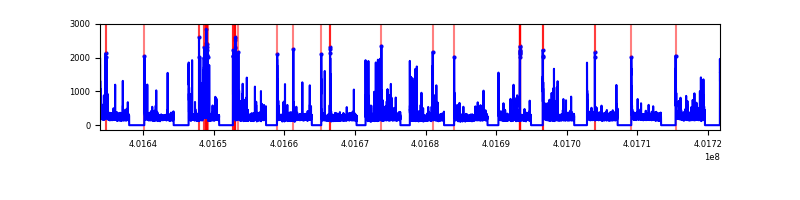 |
| D | 87768 | 63415 | 572 | 572 | 0.65% | 0.90% | 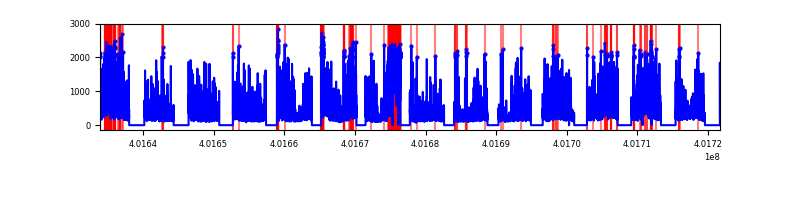 |
Top three noisy pixels from each quadrant. If the there are fewer than three noisy pixels in the level2.evt file, extra rows are filled as -1
| Pixel properties | Quadrant properties | ||||||
|---|---|---|---|---|---|---|---|
| Quadrant | DetID | PixID | Counts | Sigma | Mean | Median | Sigma |
| A | 15 | 222 | 5100386 | 7029.45 | 3259 | 3207 | 725.1 |
| A | 10 | 83 | 3244395 | 4469.88 | 3259 | 3207 | 725.1 |
| A | 9 | 143 | 487694 | 668.15 | 3259 | 3207 | 725.1 |
| B | 0 | 229 | 953712 | 1448.71 | 3297 | 3228 | 656.1 |
| B | 4 | 81 | 862707 | 1310.0 | 3297 | 3228 | 656.1 |
| B | 5 | 172 | 735066 | 1115.46 | 3297 | 3228 | 656.1 |
| C | 15 | 214 | 2749006 | 3763.67 | 3220 | 3202 | 729.6 |
| C | 0 | 207 | 844188 | 1152.74 | 3220 | 3202 | 729.6 |
| C | 0 | 10 | 679977 | 927.65 | 3220 | 3202 | 729.6 |
| D | 7 | 223 | 3584446 | 4787.36 | 3199 | 3113 | 748.1 |
| D | 12 | 235 | 1739567 | 2321.21 | 3199 | 3113 | 748.1 |
| D | 13 | 249 | 1737258 | 2318.12 | 3199 | 3113 | 748.1 |
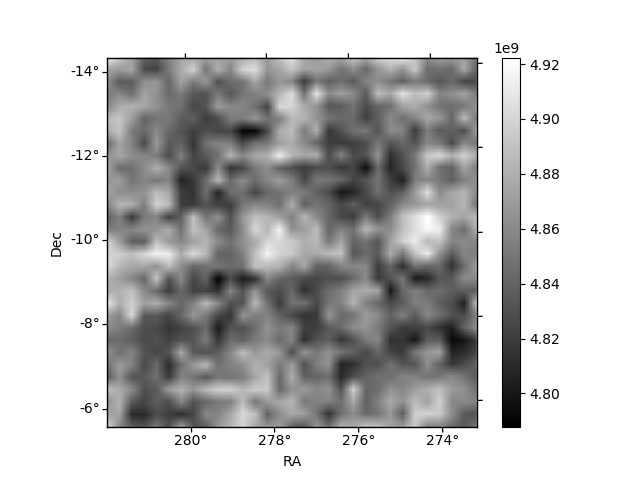
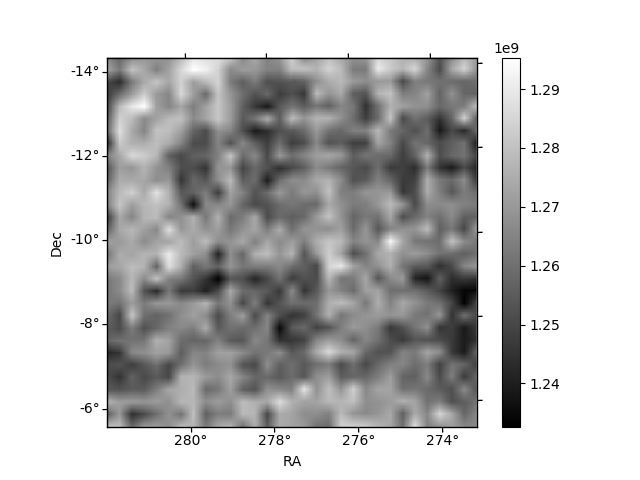
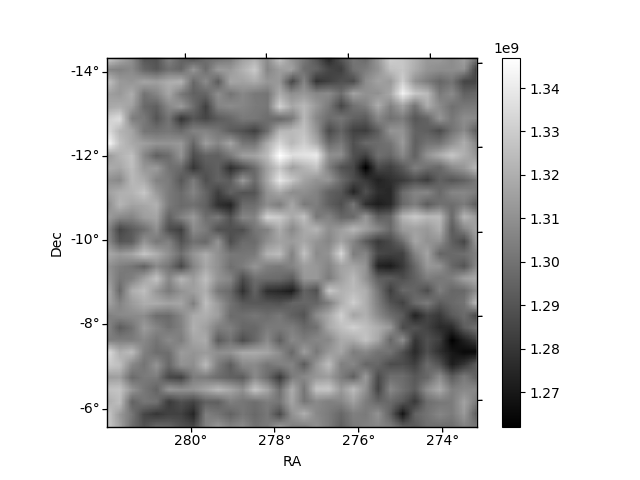
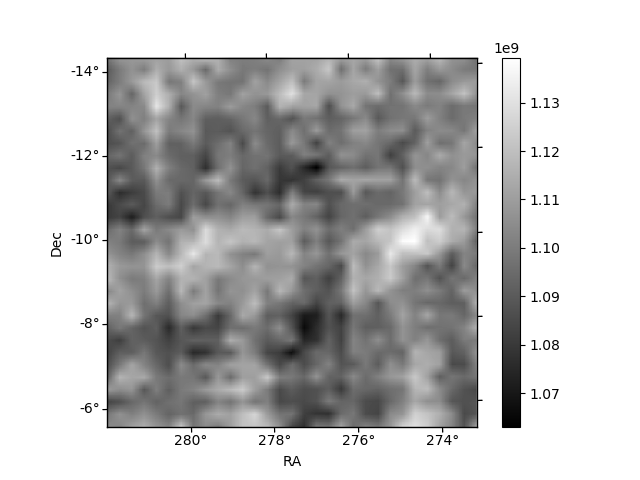
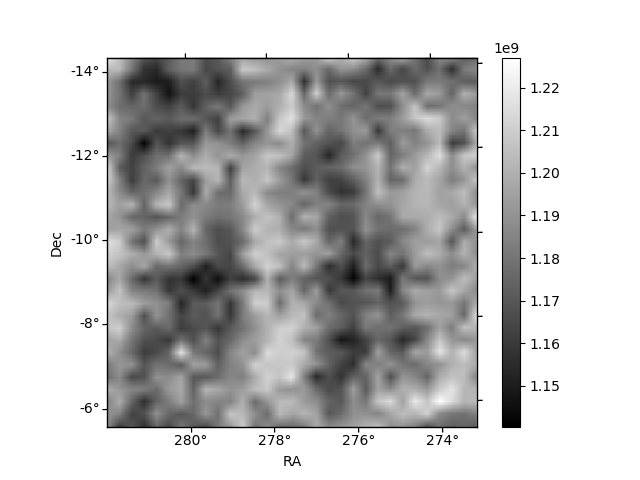
Histogram calculated using DETX and DETY for each event in the final _common_clean file
| Quadrant A | 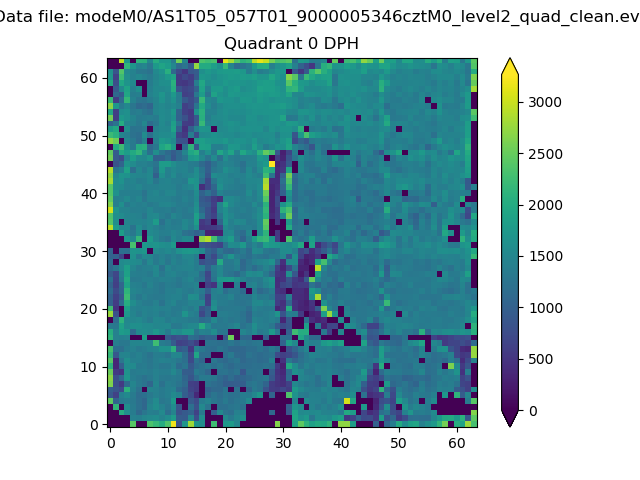 |
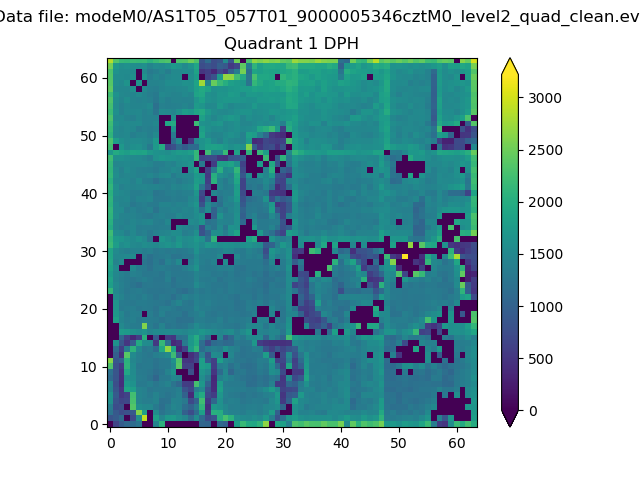 |
Quadrant B |
|---|---|---|---|
| Quadrant D | 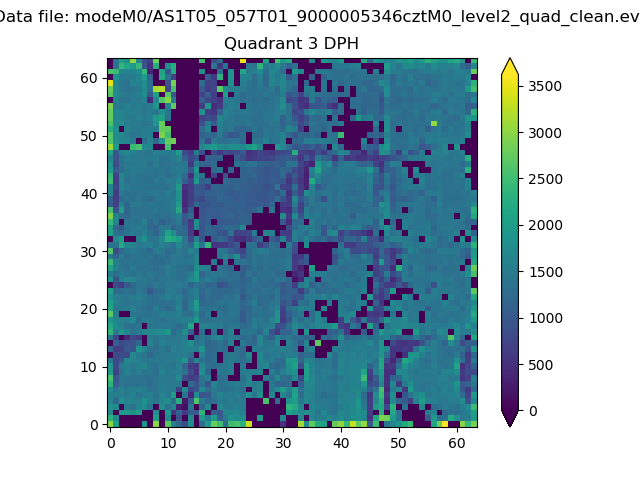 |
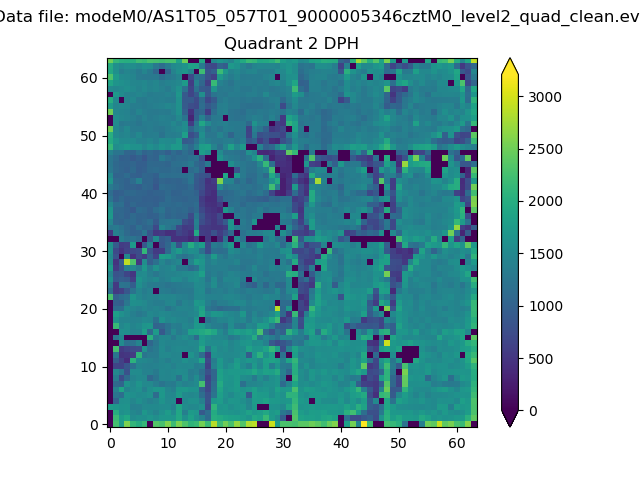 |
Quadrant C |
| Plot type | Count rate plots | Images |
|---|---|---|
| Comparison with Poisson distribution Blue bars denote a histogram of data divided into 1 sec bins. Red curve is a Poisson curve with rate = median count rate of data. |
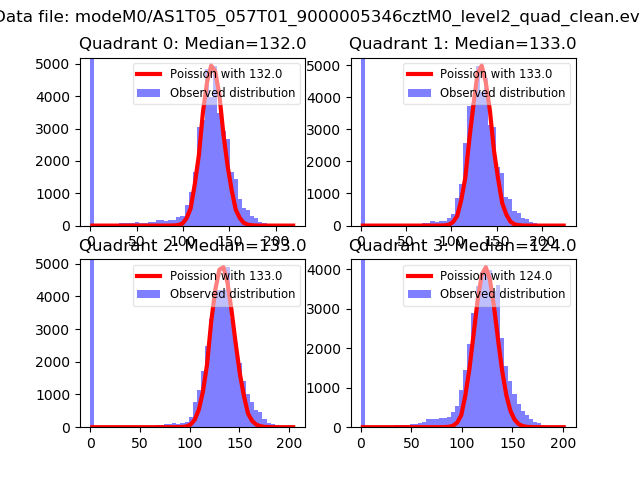 |
 |
| Quadrant-wise count rates Data is divided into 100 sec bins |
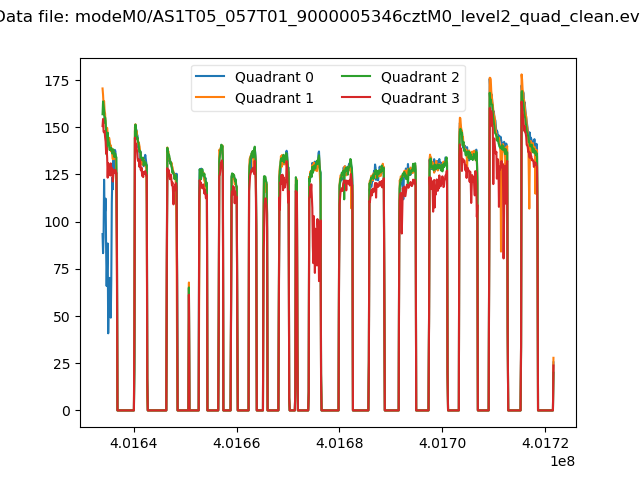 |
|
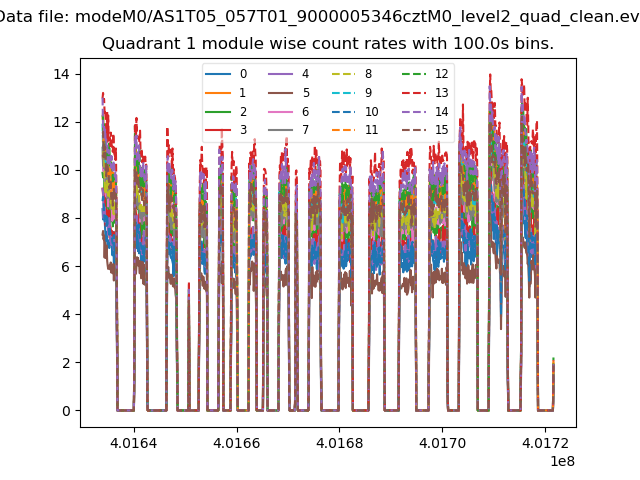
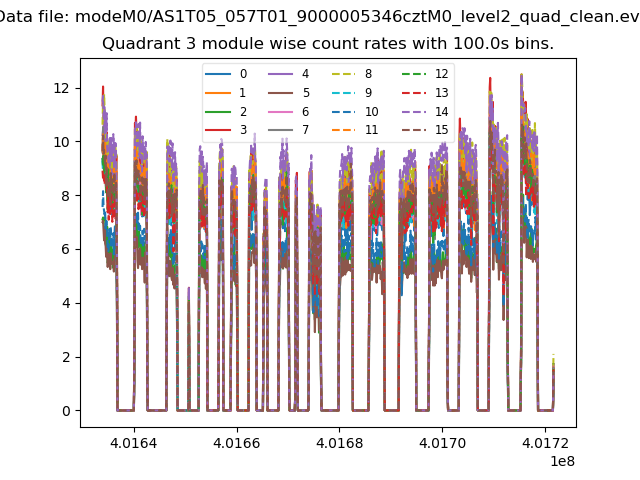
| Module-wise count rates for Quadrant A Data is divided into 100 sec bins |
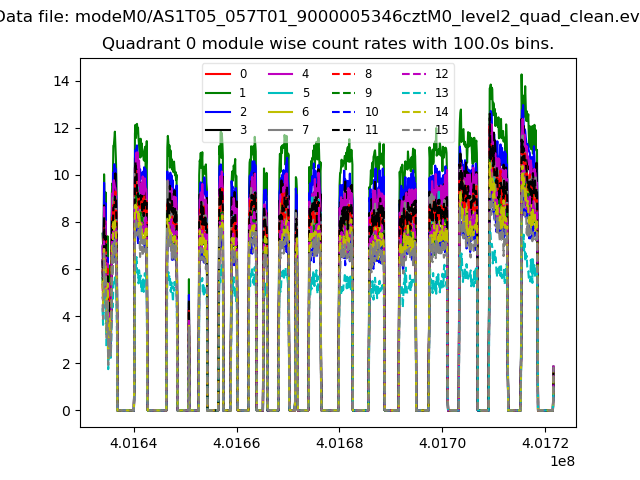 |
 |
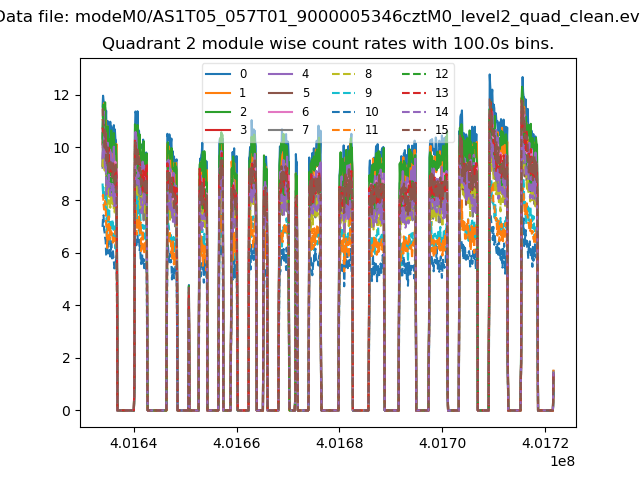
| Module-wise count rates for Quadrant B Data is divided into 100 sec bins |
 |
 |
| Module-wise count rates for Quadrant C Data is divided into 100 sec bins |
 |
 |
| Module-wise count rates for Quadrant D Data is divided into 100 sec bins |
 |
 |
| Parameter | Plot |
|---|---|
| CZT HV Monitor | 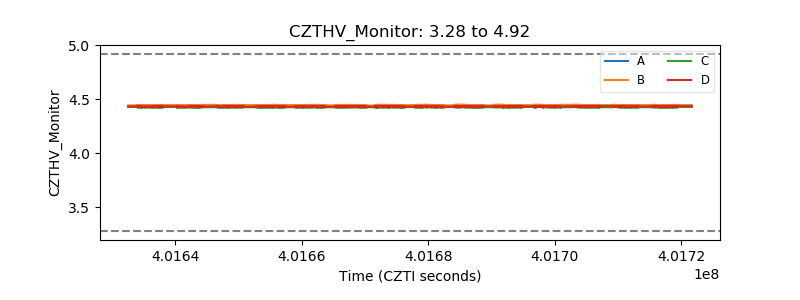 |
| D_VDD | 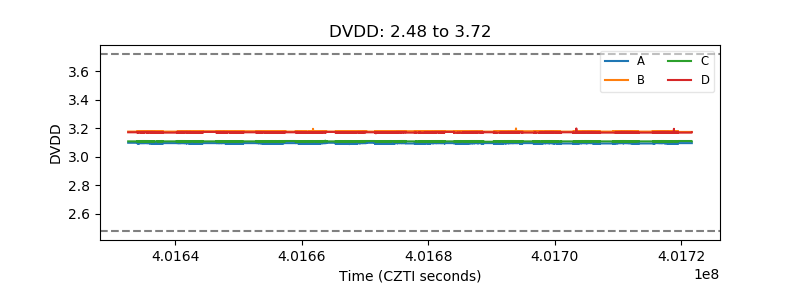 |
| Temperature 1 | 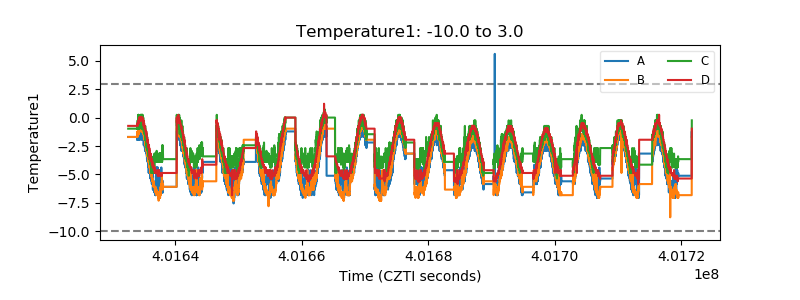 |
| Veto HV Monitor | 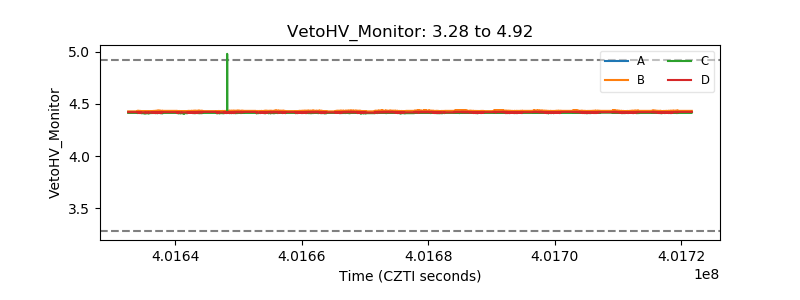 |
| Veto LLD | 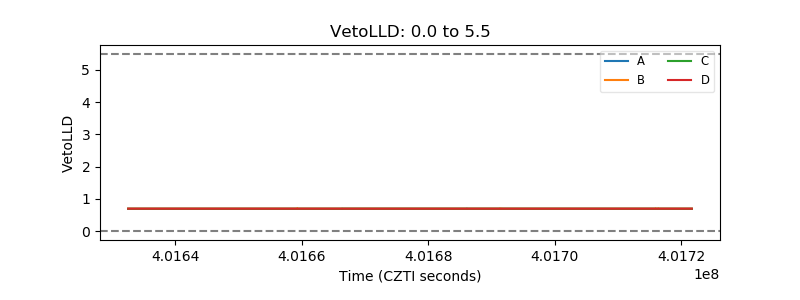 |
| Alpha Counter | 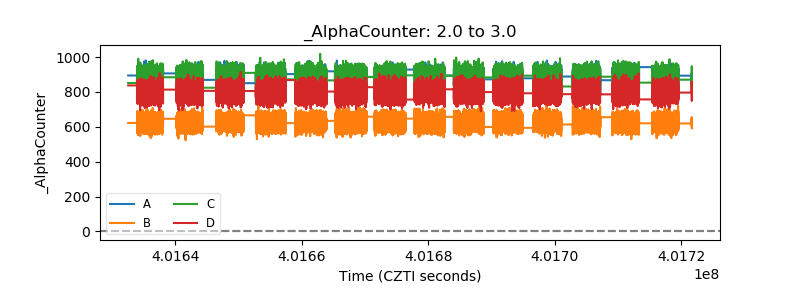 |
| _CPM_Rate | 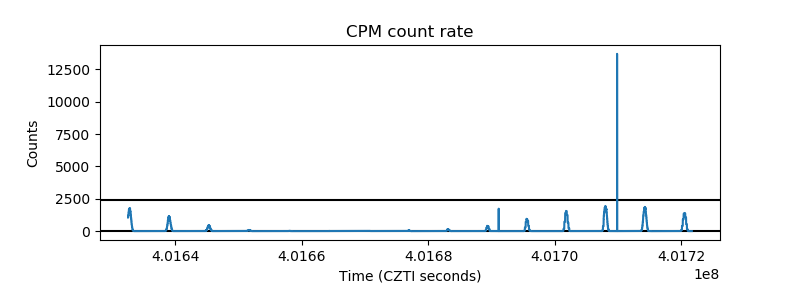 |
| CZT Counter | 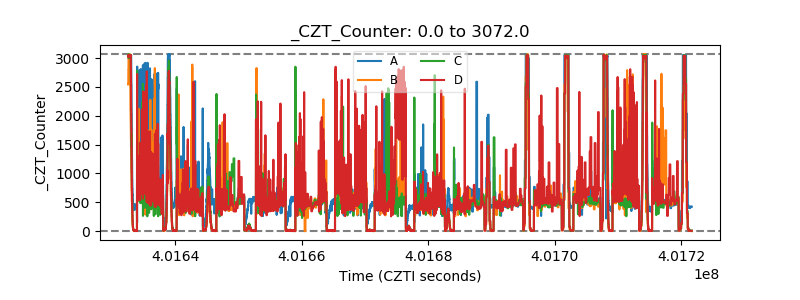 |
| +2.5 Volts monitor | 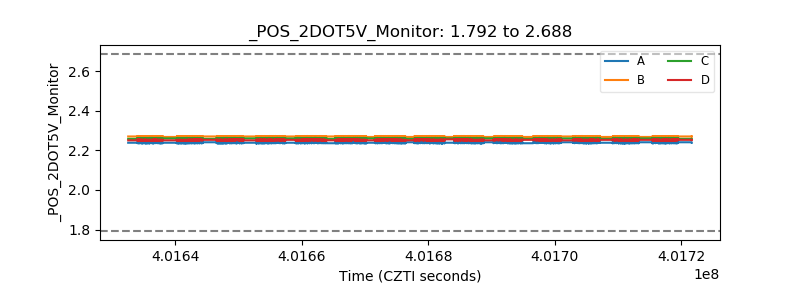 |
| +5 Volts monitor | 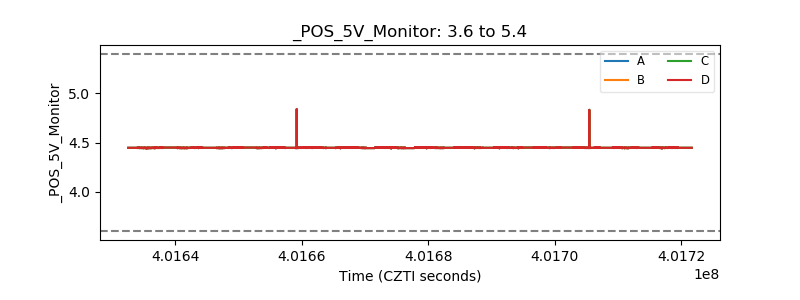 |
| _ROLL_ROT | 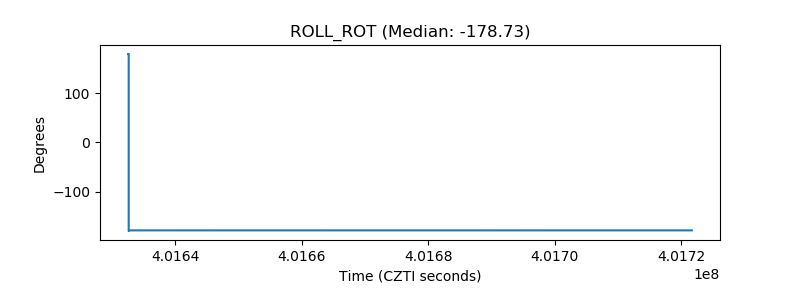 |
| _Roll_DEC | 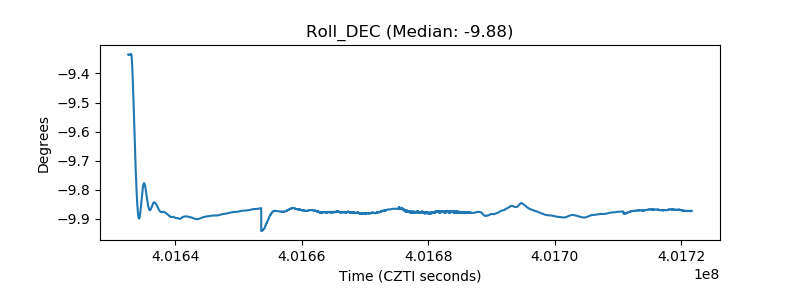 |
| _Roll_RA | 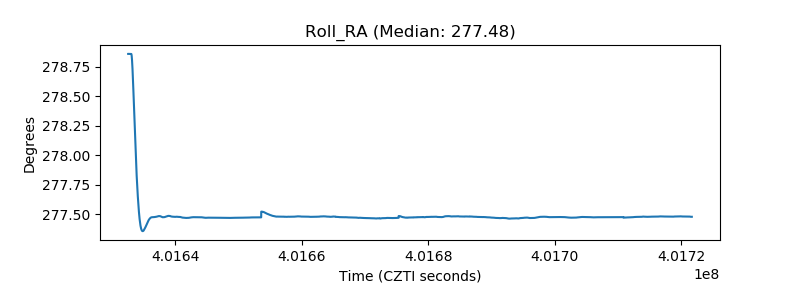 |
| Veto Counter | 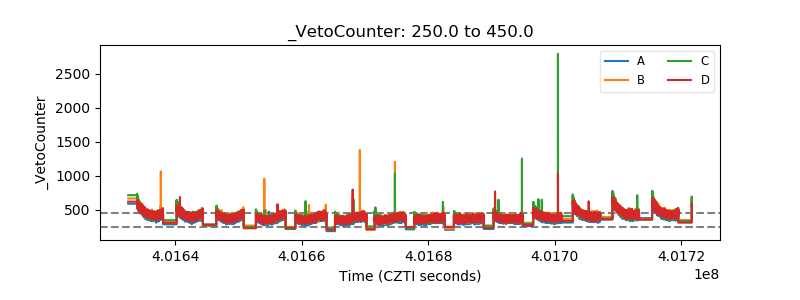 |