| Param | Original file | Final file |
|---|---|---|
| Filename | modeM0/AS1A12_083T01_9000005448cztM0_level2.fits | modeM0/AS1A12_083T01_9000005448cztM0_level2_quad_clean.evt |
| Size (bytes) | 158,918,400 | 168,877,440 |
| Size | 151.6 MB | 161.1 MB |
| Events in quadrant A | 982,330 | 1,065,333 |
| Events in quadrant B | 951,986 | 1,098,155 |
| Events in quadrant C | 975,890 | 1,053,961 |
| Events in quadrant D | 596,680 | 595,233 |
| Mode M0 | |||
|---|---|---|---|
| Quadrant | BADHDUFLAG | Total packets | Discarded packets |
| A | 0 | 53253 | 0 |
| B | 0 | 41343 | 0 |
| C | 0 | 39918 | 0 |
| D | 0 | 120921 | 0 |
| Mode M9 | |||
|---|---|---|---|
| Quadrant | BADHDUFLAG | Total packets | Discarded packets |
| A | 0 | 53 | 0 |
| B | 0 | 53 | 0 |
| C | 0 | 53 | 0 |
| D | 0 | 53 | 0 |
| Mode SS | |||
|---|---|---|---|
| Quadrant | BADHDUFLAG | Total packets | Discarded packets |
| A | 0 | 386 | 0 |
| B | 0 | 386 | 0 |
| C | 0 | 386 | 0 |
| D | 0 | 386 | 0 |
| Quadrant | Total seconds | Saturated seconds | Saturation percentage |
|---|---|---|---|
| A | 18870 | 875 | 4.636990% |
| B | 18875 | 327 | 1.732450% |
| C | 18875 | 65 | 0.344371% |
| D | 18875 | 10787 | 57.149669% |
Noise dominated data is calculated using 1-second bins in cleaned event files. If a bin has >2000 counts, and if more than 50% of those come from <1% of pixels, then it is considered to be noise-dominated and hence unusable.
| Quadrant | # 1 sec bins | Bins with >0 counts | Bins with >2000 counts | High rate bins dominated by noise | Noise dominated (total time) | Noise dominated (detector-on time) | Marked lightcurve |
|---|---|---|---|---|---|---|---|
| A | 24247 | 18873 | 0 | 0 | 0.00% | 0.00% |  |
| B | 24247 | 18874 | 0 | 0 | 0.00% | 0.00% |  |
| C | 24247 | 18875 | 0 | 0 | 0.00% | 0.00% |  |
| D | 24247 | 18834 | 0 | 0 | 0.00% | 0.00% |  |
Top three noisy pixels from each quadrant. If the there are fewer than three noisy pixels in the level2.evt file, extra rows are filled as -1
| Pixel properties | Quadrant properties | ||||||
|---|---|---|---|---|---|---|---|
| Quadrant | DetID | PixID | Counts | Sigma | Mean | Median | Sigma |
| A | 7 | 110 | 832 | 8.7 | 256 | 239 | 68.2 |
| A | 0 | 29 | 827 | 8.63 | 256 | 239 | 68.2 |
| A | 9 | 19 | 773 | 7.84 | 256 | 239 | 68.2 |
| B | 2 | 9 | 890 | 12.67 | 251 | 238 | 51.5 |
| B | 3 | 80 | 723 | 9.42 | 251 | 238 | 51.5 |
| B | 2 | 8 | 696 | 8.9 | 251 | 238 | 51.5 |
| C | 1 | 80 | 806 | 8.26 | 258 | 241 | 68.4 |
| C | 1 | 81 | 788 | 8.0 | 258 | 241 | 68.4 |
| C | 3 | 203 | 763 | 7.63 | 258 | 241 | 68.4 |
| D | 4 | 160 | 480 | 6.9 | 170 | 155 | 47.1 |
| D | 6 | 62 | 458 | 6.44 | 170 | 155 | 47.1 |
| D | 7 | 3 | 448 | 6.22 | 170 | 155 | 47.1 |
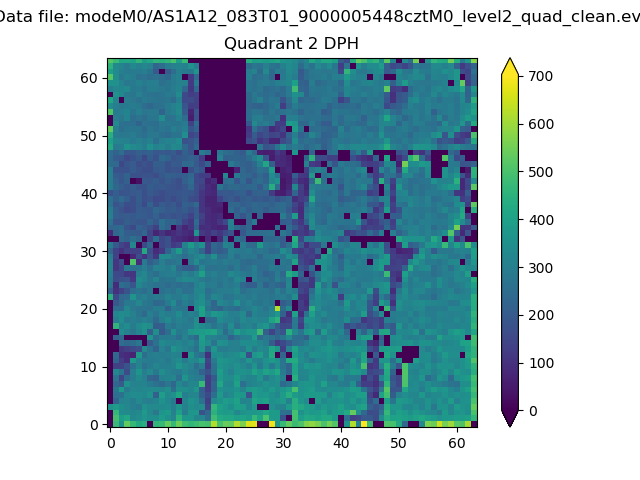
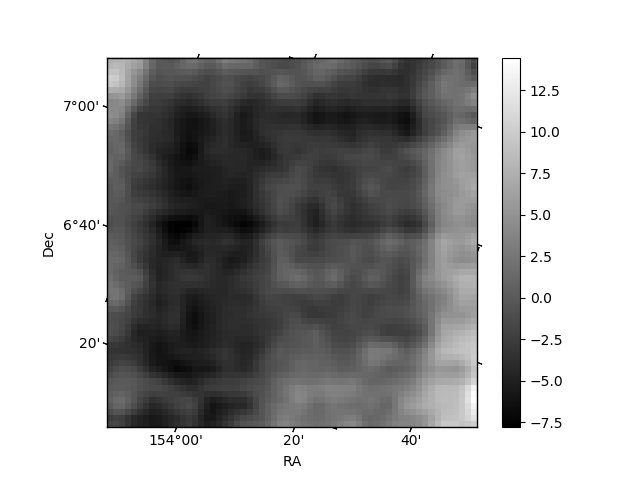
Histogram calculated using DETX and DETY for each event in the final _common_clean file
| Quadrant A |  |
 |
Quadrant B |
|---|---|---|---|
| Quadrant D | 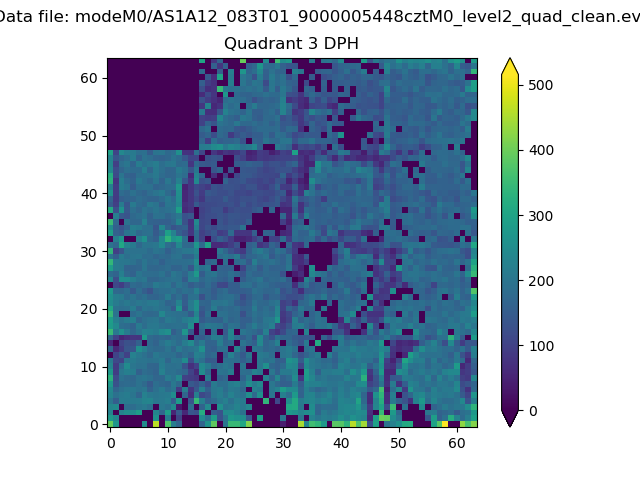 |
 |
Quadrant C |
| Plot type | Count rate plots | Images |
|---|---|---|
| Comparison with Poisson distribution Blue bars denote a histogram of data divided into 1 sec bins. Red curve is a Poisson curve with rate = median count rate of data. |
 |
 |
| Quadrant-wise count rates Data is divided into 100 sec bins |
 |
|
| Module-wise count rates for Quadrant A Data is divided into 100 sec bins |
 |
 |
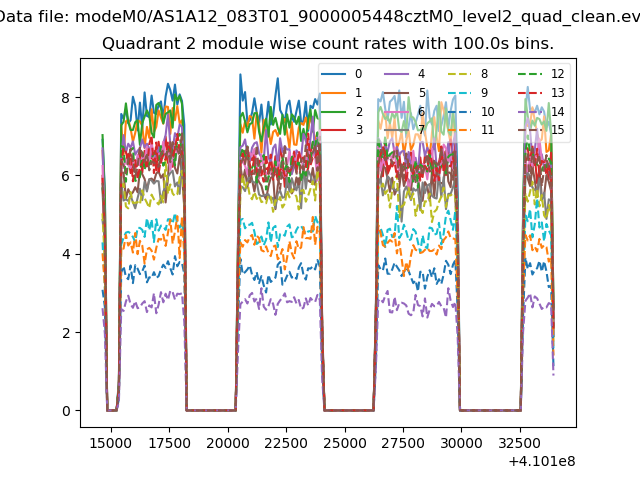
| Module-wise count rates for Quadrant B Data is divided into 100 sec bins |
 |
 |
| Module-wise count rates for Quadrant C Data is divided into 100 sec bins |
 |
 |
| Module-wise count rates for Quadrant D Data is divided into 100 sec bins |
 |
 |
| Parameter | Plot |
|---|---|
| CZT HV Monitor |  |
| D_VDD |  |
| Temperature 1 | 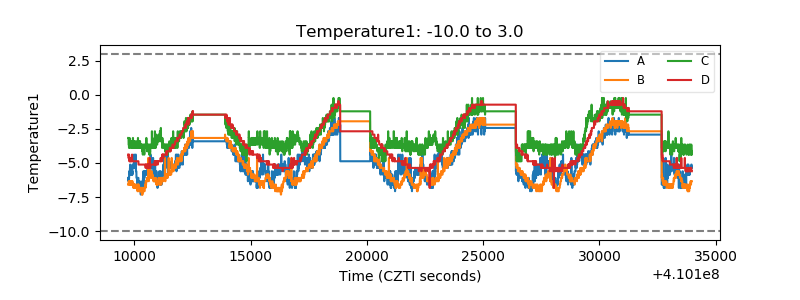 |
| Veto HV Monitor |  |
| Veto LLD | 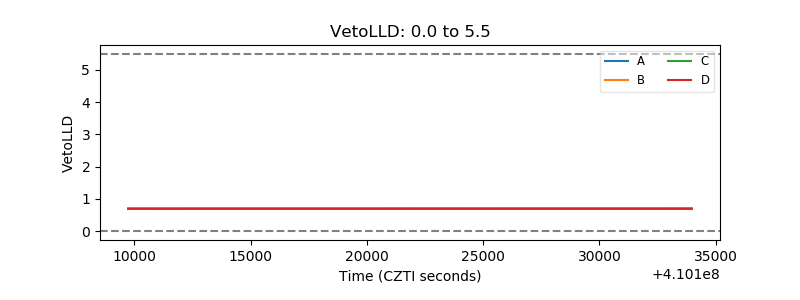 |
| Alpha Counter |  |
| _CPM_Rate |  |
| CZT Counter |  |
| +2.5 Volts monitor |  |
| +5 Volts monitor | 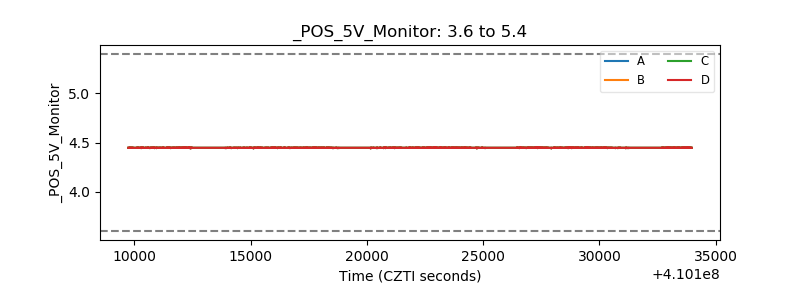 |
| _ROLL_ROT |  |
| _Roll_DEC |  |
| _Roll_RA | 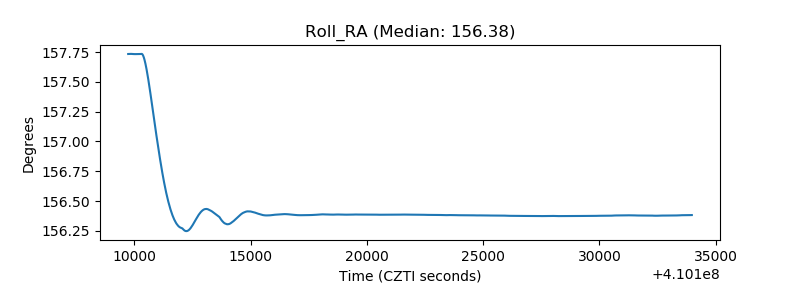 |
| Veto Counter | 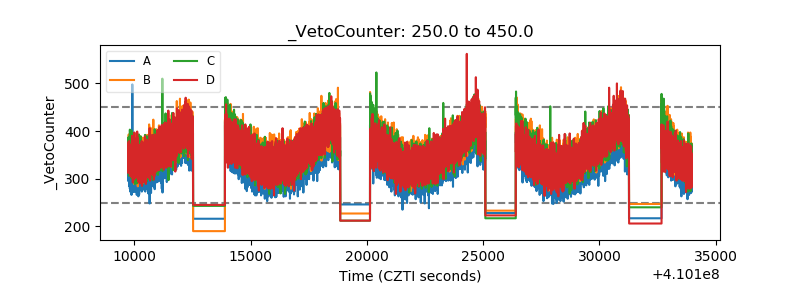 |