| Param | Original file | Final file |
|---|---|---|
| Filename | modeM0/AS1A12_054T02_9000005444cztM0_level2.fits | modeM0/AS1A12_054T02_9000005444cztM0_level2_quad_clean.evt |
| Size (bytes) | 2,159,398,080 | 2,417,880,960 |
| Size | 2.0 GB | 2.3 GB |
| Events in quadrant A | 13,378,418 | 15,745,470 |
| Events in quadrant B | 12,737,402 | 15,532,542 |
| Events in quadrant C | 12,959,472 | 14,754,140 |
| Events in quadrant D | 9,766,800 | 10,673,245 |
| Mode M9 | |||
|---|---|---|---|
| Quadrant | BADHDUFLAG | Total packets | Discarded packets |
| A | 0 | 904 | 0 |
| B | 0 | 904 | 0 |
| C | 0 | 904 | 0 |
| D | 0 | 904 | 0 |
| Mode M0 | |||
|---|---|---|---|
| Quadrant | BADHDUFLAG | Total packets | Discarded packets |
| A | 0 | 526853 | 0 |
| B | 0 | 496910 | 0 |
| C | 0 | 502576 | 0 |
| D | 0 | 1196020 | 0 |
| Mode SS | |||
|---|---|---|---|
| Quadrant | BADHDUFLAG | Total packets | Discarded packets |
| A | 0 | 4926 | 0 |
| B | 0 | 4926 | 0 |
| C | 0 | 4926 | 0 |
| D | 0 | 4926 | 0 |
| Quadrant | Total seconds | Saturated seconds | Saturation percentage |
|---|---|---|---|
| A | 241267 | 1396 | 0.578612% |
| B | 241268 | 1082 | 0.448464% |
| C | 241269 | 884 | 0.366396% |
| D | 241265 | 69215 | 28.688372% |
Noise dominated data is calculated using 1-second bins in cleaned event files. If a bin has >2000 counts, and if more than 50% of those come from <1% of pixels, then it is considered to be noise-dominated and hence unusable.
| Quadrant | # 1 sec bins | Bins with >0 counts | Bins with >2000 counts | High rate bins dominated by noise | Noise dominated (total time) | Noise dominated (detector-on time) | Marked lightcurve |
|---|---|---|---|---|---|---|---|
| A | 329853 | 241266 | 0 | 0 | 0.00% | 0.00% |  |
| B | 329853 | 241245 | 0 | 0 | 0.00% | 0.00% |  |
| C | 329853 | 241257 | 0 | 0 | 0.00% | 0.00% |  |
| D | 329853 | 241032 | 0 | 0 | 0.00% | 0.00% |  |
Top three noisy pixels from each quadrant. If the there are fewer than three noisy pixels in the level2.evt file, extra rows are filled as -1
| Pixel properties | Quadrant properties | ||||||
|---|---|---|---|---|---|---|---|
| Quadrant | DetID | PixID | Counts | Sigma | Mean | Median | Sigma |
| A | 9 | 19 | 11240 | 9.24 | 3491 | 3287 | 860.7 |
| A | 7 | 110 | 10993 | 8.95 | 3491 | 3287 | 860.7 |
| A | 0 | 29 | 10716 | 8.63 | 3491 | 3287 | 860.7 |
| B | 2 | 9 | 11061 | 12.15 | 3370 | 3224 | 645.1 |
| B | 3 | 80 | 9726 | 10.08 | 3370 | 3224 | 645.1 |
| B | 3 | 17 | 8897 | 8.79 | 3370 | 3224 | 645.1 |
| C | 1 | 81 | 10957 | 8.97 | 3420 | 3210 | 863.7 |
| C | 1 | 80 | 10457 | 8.39 | 3420 | 3210 | 863.7 |
| C | 3 | 202 | 10217 | 8.11 | 3420 | 3210 | 863.7 |
| D | 10 | 189 | 7195 | 6.17 | 2796 | 2544 | 753.2 |
| D | 7 | 3 | 7151 | 6.12 | 2796 | 2544 | 753.2 |
| D | 4 | 160 | 7017 | 5.94 | 2796 | 2544 | 753.2 |
Histogram calculated using DETX and DETY for each event in the final _common_clean file
| Quadrant A |  |
 |
Quadrant B |
|---|---|---|---|
| Quadrant D |  |
 |
Quadrant C |
| Plot type | Count rate plots | Images |
|---|---|---|
| Comparison with Poisson distribution Blue bars denote a histogram of data divided into 1 sec bins. Red curve is a Poisson curve with rate = median count rate of data. |
 |
 |
| Quadrant-wise count rates Data is divided into 100 sec bins |
 |
|
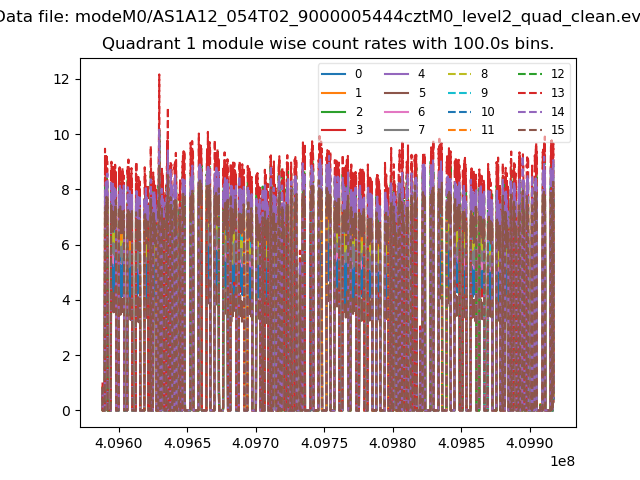
| Module-wise count rates for Quadrant A Data is divided into 100 sec bins |
 |
 |
| Module-wise count rates for Quadrant B Data is divided into 100 sec bins |
 |
 |
| Module-wise count rates for Quadrant C Data is divided into 100 sec bins |
 |
 |
| Module-wise count rates for Quadrant D Data is divided into 100 sec bins |
 |
 |
| Parameter | Plot |
|---|---|
| CZT HV Monitor |  |
| D_VDD |  |
| Temperature 1 |  |
| Veto HV Monitor |  |
| Veto LLD |  |
| Alpha Counter |  |
| _CPM_Rate |  |
| CZT Counter | 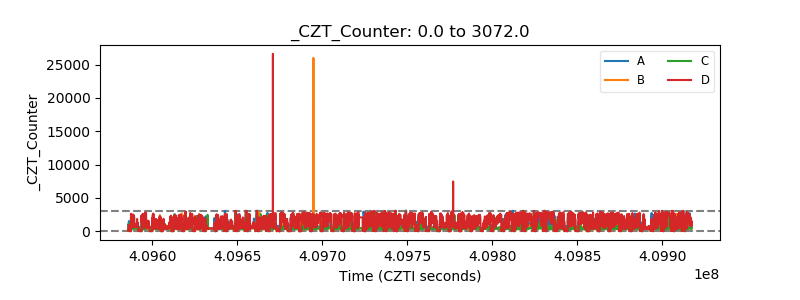 |
| +2.5 Volts monitor |  |
| +5 Volts monitor |  |
| _ROLL_ROT | 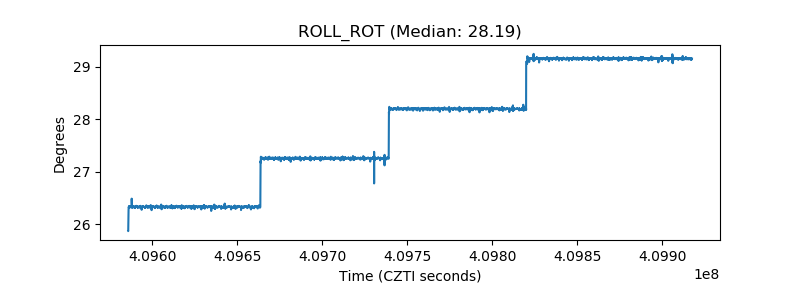 |
| _Roll_DEC |  |
| _Roll_RA |  |
| Veto Counter |  |