| Param | Original file | Final file |
|---|---|---|
| Filename | modeM0/AS1C06_010T05_9000005436cztM0_level2.fits | modeM0/AS1C06_010T05_9000005436cztM0_level2_quad_clean.evt |
| Size (bytes) | 101,341,440 | 124,303,680 |
| Size | 96.6 MB | 118.5 MB |
| Events in quadrant A | 645,734 | 850,671 |
| Events in quadrant B | 592,286 | 815,291 |
| Events in quadrant C | 608,254 | 765,602 |
| Events in quadrant D | 502,674 | 612,430 |
| Mode M0 | |||
|---|---|---|---|
| Quadrant | BADHDUFLAG | Total packets | Discarded packets |
| A | 0 | 22682 | 0 |
| B | 0 | 24219 | 0 |
| C | 0 | 22901 | 0 |
| D | 0 | 48710 | 0 |
| Mode M9 | |||
|---|---|---|---|
| Quadrant | BADHDUFLAG | Total packets | Discarded packets |
| A | 0 | 56 | 0 |
| B | 0 | 56 | 0 |
| C | 0 | 56 | 0 |
| D | 0 | 56 | 0 |
| Mode SS | |||
|---|---|---|---|
| Quadrant | BADHDUFLAG | Total packets | Discarded packets |
| A | 0 | 212 | 0 |
| B | 0 | 212 | 0 |
| C | 0 | 212 | 0 |
| D | 0 | 212 | 0 |
| Quadrant | Total seconds | Saturated seconds | Saturation percentage |
|---|---|---|---|
| A | 10394 | 33 | 0.317491% |
| B | 10394 | 252 | 2.424476% |
| C | 10394 | 67 | 0.644603% |
| D | 10394 | 1522 | 14.643063% |
Noise dominated data is calculated using 1-second bins in cleaned event files. If a bin has >2000 counts, and if more than 50% of those come from <1% of pixels, then it is considered to be noise-dominated and hence unusable.
| Quadrant | # 1 sec bins | Bins with >0 counts | Bins with >2000 counts | High rate bins dominated by noise | Noise dominated (total time) | Noise dominated (detector-on time) | Marked lightcurve |
|---|---|---|---|---|---|---|---|
| A | 14488 | 10393 | 0 | 0 | 0.00% | 0.00% |  |
| B | 14488 | 10392 | 0 | 0 | 0.00% | 0.00% |  |
| C | 14488 | 10393 | 0 | 0 | 0.00% | 0.00% |  |
| D | 14488 | 10391 | 0 | 0 | 0.00% | 0.00% |  |
Top three noisy pixels from each quadrant. If the there are fewer than three noisy pixels in the level2.evt file, extra rows are filled as -1
| Pixel properties | Quadrant properties | ||||||
|---|---|---|---|---|---|---|---|
| Quadrant | DetID | PixID | Counts | Sigma | Mean | Median | Sigma |
| A | 9 | 19 | 547 | 8.88 | 168 | 160 | 43.6 |
| A | 7 | 110 | 536 | 8.62 | 168 | 160 | 43.6 |
| A | 0 | 29 | 509 | 8.0 | 168 | 160 | 43.6 |
| B | 2 | 9 | 491 | 10.35 | 157 | 151 | 32.9 |
| B | 5 | 128 | 431 | 8.52 | 157 | 151 | 32.9 |
| B | 5 | 255 | 429 | 8.46 | 157 | 151 | 32.9 |
| C | 3 | 203 | 479 | 7.8 | 160 | 152 | 41.9 |
| C | 3 | 202 | 473 | 7.65 | 160 | 152 | 41.9 |
| C | 1 | 81 | 465 | 7.46 | 160 | 152 | 41.9 |
| D | 7 | 3 | 381 | 6.31 | 143 | 132 | 39.5 |
| D | 6 | 231 | 367 | 5.95 | 143 | 132 | 39.5 |
| D | 10 | 189 | 364 | 5.88 | 143 | 132 | 39.5 |
Histogram calculated using DETX and DETY for each event in the final _common_clean file
| Quadrant A | 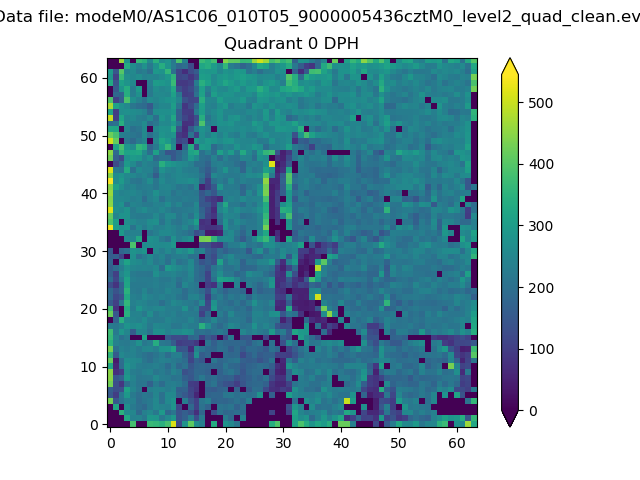 |
 |
Quadrant B |
|---|---|---|---|
| Quadrant D |  |
 |
Quadrant C |
| Plot type | Count rate plots | Images |
|---|---|---|
| Comparison with Poisson distribution Blue bars denote a histogram of data divided into 1 sec bins. Red curve is a Poisson curve with rate = median count rate of data. |
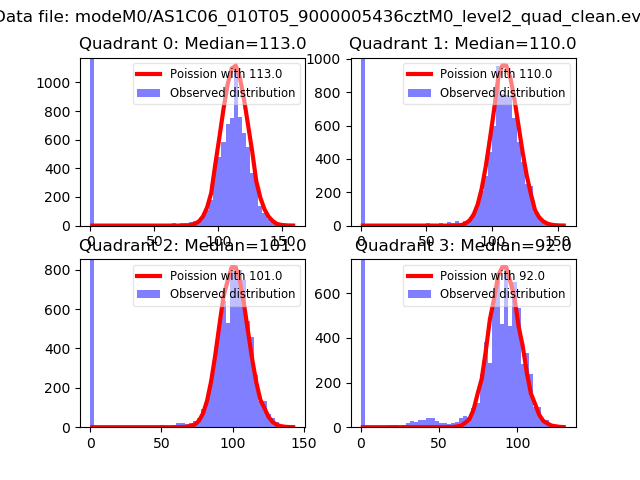 |
 |
| Quadrant-wise count rates Data is divided into 100 sec bins |
 |
|
| Module-wise count rates for Quadrant A Data is divided into 100 sec bins |
 |
 |
| Module-wise count rates for Quadrant B Data is divided into 100 sec bins |
 |
 |
| Module-wise count rates for Quadrant C Data is divided into 100 sec bins |
 |
 |
| Module-wise count rates for Quadrant D Data is divided into 100 sec bins |
 |
 |
| Parameter | Plot |
|---|---|
| CZT HV Monitor | 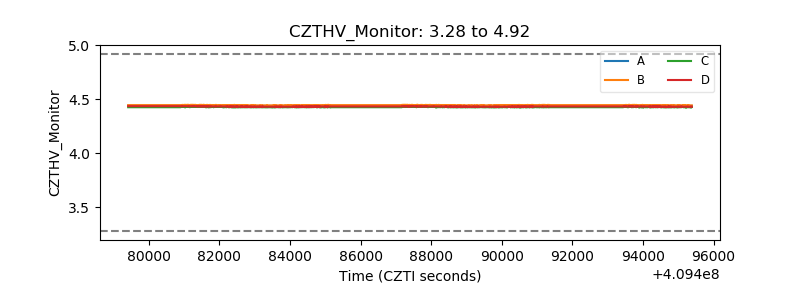 |
| D_VDD |  |
| Temperature 1 |  |
| Veto HV Monitor |  |
| Veto LLD |  |
| Alpha Counter |  |
| _CPM_Rate |  |
| CZT Counter |  |
| +2.5 Volts monitor |  |
| +5 Volts monitor |  |
| _ROLL_ROT |  |
| _Roll_DEC |  |
| _Roll_RA | 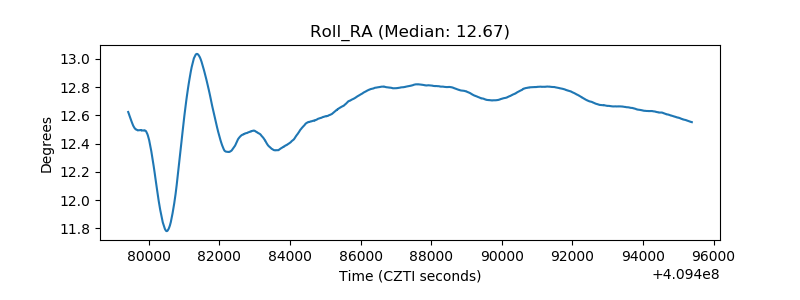 |
| Veto Counter |  |