| Param | Original file | Final file |
|---|---|---|
| Filename | modeM0/AS1A12_044T16_9000005442cztM0_level2.fits | modeM0/AS1A12_044T16_9000005442cztM0_level2_quad_clean.evt |
| Size (bytes) | 348,422,400 | 344,347,200 |
| Size | 332.3 MB | 328.4 MB |
| Events in quadrant A | 2,155,096 | 2,121,176 |
| Events in quadrant B | 2,076,916 | 2,102,606 |
| Events in quadrant C | 2,047,812 | 1,927,156 |
| Events in quadrant D | 1,729,974 | 1,736,581 |
| Mode M0 | |||
|---|---|---|---|
| Quadrant | BADHDUFLAG | Total packets | Discarded packets |
| A | 0 | 80463 | 0 |
| B | 0 | 75347 | 0 |
| C | 0 | 96751 | 0 |
| D | 0 | 147218 | 0 |
| Mode M9 | |||
|---|---|---|---|
| Quadrant | BADHDUFLAG | Total packets | Discarded packets |
| A | 0 | 141 | 0 |
| B | 0 | 141 | 0 |
| C | 0 | 141 | 0 |
| D | 0 | 141 | 0 |
| Mode SS | |||
|---|---|---|---|
| Quadrant | BADHDUFLAG | Total packets | Discarded packets |
| A | 0 | 754 | 0 |
| B | 0 | 754 | 0 |
| C | 0 | 754 | 0 |
| D | 0 | 754 | 0 |
| Quadrant | Total seconds | Saturated seconds | Saturation percentage |
|---|---|---|---|
| A | 36991 | 114 | 0.308183% |
| B | 36991 | 109 | 0.294666% |
| C | 36991 | 1678 | 4.536239% |
| D | 36991 | 4393 | 11.875862% |
Noise dominated data is calculated using 1-second bins in cleaned event files. If a bin has >2000 counts, and if more than 50% of those come from <1% of pixels, then it is considered to be noise-dominated and hence unusable.
| Quadrant | # 1 sec bins | Bins with >0 counts | Bins with >2000 counts | High rate bins dominated by noise | Noise dominated (total time) | Noise dominated (detector-on time) | Marked lightcurve |
|---|---|---|---|---|---|---|---|
| A | 51033 | 36990 | 0 | 0 | 0.00% | 0.00% |  |
| B | 51033 | 36992 | 0 | 0 | 0.00% | 0.00% |  |
| C | 51033 | 36991 | 0 | 0 | 0.00% | 0.00% |  |
| D | 51033 | 36990 | 0 | 0 | 0.00% | 0.00% | 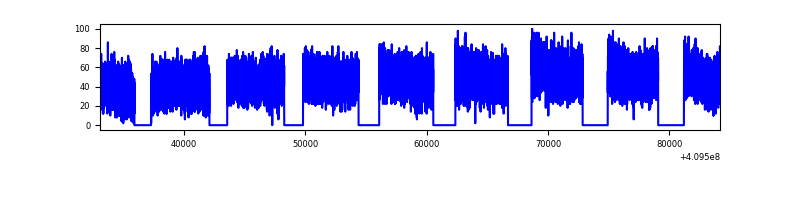 |
Top three noisy pixels from each quadrant. If the there are fewer than three noisy pixels in the level2.evt file, extra rows are filled as -1
| Pixel properties | Quadrant properties | ||||||
|---|---|---|---|---|---|---|---|
| Quadrant | DetID | PixID | Counts | Sigma | Mean | Median | Sigma |
| A | 9 | 19 | 1817 | 9.13 | 563 | 530 | 140.9 |
| A | 7 | 110 | 1715 | 8.41 | 563 | 530 | 140.9 |
| A | 0 | 29 | 1692 | 8.25 | 563 | 530 | 140.9 |
| B | 2 | 9 | 1679 | 10.55 | 548 | 523 | 109.6 |
| B | 3 | 80 | 1646 | 10.25 | 548 | 523 | 109.6 |
| B | 3 | 17 | 1417 | 8.16 | 548 | 523 | 109.6 |
| C | 1 | 81 | 1670 | 8.33 | 542 | 509 | 139.4 |
| C | 1 | 80 | 1620 | 7.97 | 542 | 509 | 139.4 |
| C | 3 | 202 | 1616 | 7.94 | 542 | 509 | 139.4 |
| D | 3 | 14 | 1294 | 6.35 | 494 | 451 | 132.8 |
| D | 7 | 3 | 1245 | 5.98 | 494 | 451 | 132.8 |
| D | 10 | 189 | 1234 | 5.9 | 494 | 451 | 132.8 |
Histogram calculated using DETX and DETY for each event in the final _common_clean file
| Quadrant A | 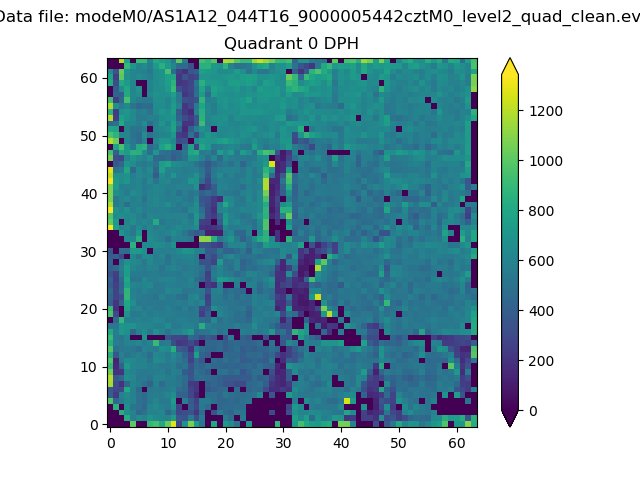 |
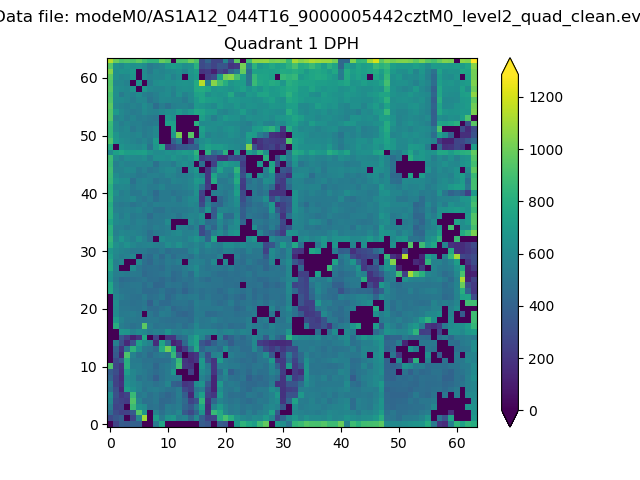 |
Quadrant B |
|---|---|---|---|
| Quadrant D |  |
 |
Quadrant C |
| Plot type | Count rate plots | Images |
|---|---|---|
| Comparison with Poisson distribution Blue bars denote a histogram of data divided into 1 sec bins. Red curve is a Poisson curve with rate = median count rate of data. |
 |
 |
| Quadrant-wise count rates Data is divided into 100 sec bins |
 |
|
| Module-wise count rates for Quadrant A Data is divided into 100 sec bins |
 |
 |
| Module-wise count rates for Quadrant B Data is divided into 100 sec bins |
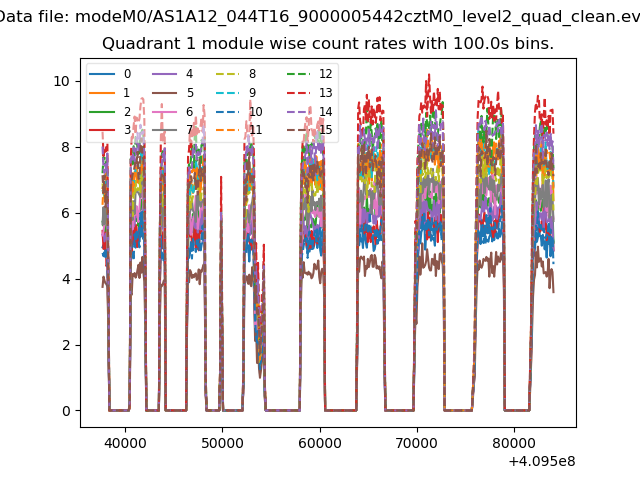 |
 |
| Module-wise count rates for Quadrant C Data is divided into 100 sec bins |
 |
 |
| Module-wise count rates for Quadrant D Data is divided into 100 sec bins |
 |
 |
| Parameter | Plot |
|---|---|
| CZT HV Monitor | 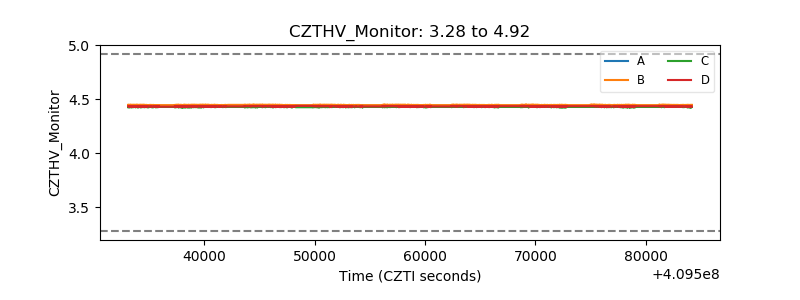 |
| D_VDD |  |
| Temperature 1 | 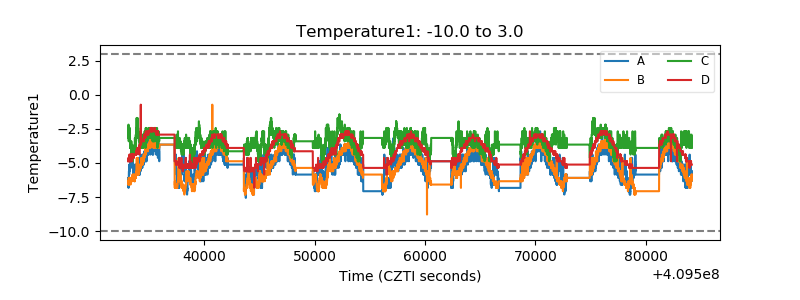 |
| Veto HV Monitor |  |
| Veto LLD |  |
| Alpha Counter |  |
| _CPM_Rate |  |
| CZT Counter |  |
| +2.5 Volts monitor | 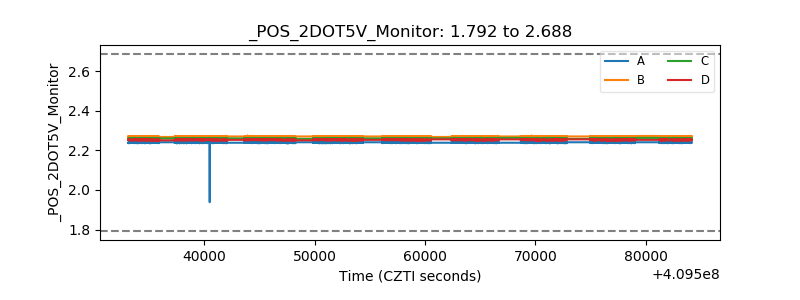 |
| +5 Volts monitor | 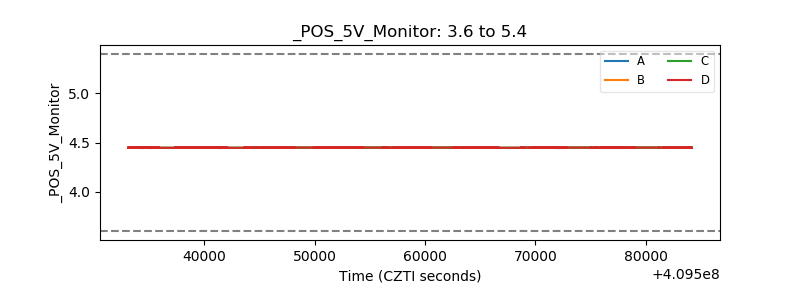 |
| _ROLL_ROT |  |
| _Roll_DEC |  |
| _Roll_RA | 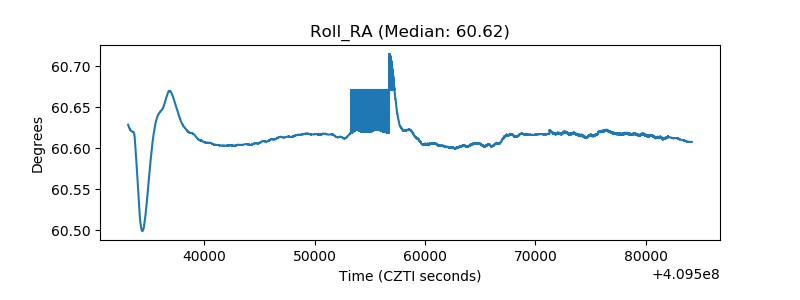 |
| Veto Counter | 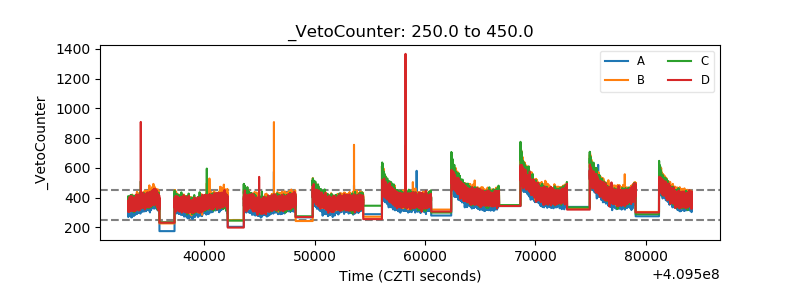 |