| Param | Original file | Final file |
|---|---|---|
| Filename | modeM0/AS1A12_044T04_9000005434cztM0_level2.fits | modeM0/AS1A12_044T04_9000005434cztM0_level2_quad_clean.evt |
| Size (bytes) | 353,738,880 | 390,634,560 |
| Size | 337.4 MB | 372.5 MB |
| Events in quadrant A | 2,129,052 | 2,402,461 |
| Events in quadrant B | 2,027,980 | 2,392,082 |
| Events in quadrant C | 2,082,022 | 2,326,905 |
| Events in quadrant D | 1,751,624 | 1,987,228 |
| Mode SS | |||
|---|---|---|---|
| Quadrant | BADHDUFLAG | Total packets | Discarded packets |
| A | 0 | 806 | 0 |
| B | 0 | 806 | 0 |
| C | 0 | 806 | 0 |
| D | 0 | 806 | 0 |
| Mode M0 | |||
|---|---|---|---|
| Quadrant | BADHDUFLAG | Total packets | Discarded packets |
| A | 0 | 86278 | 0 |
| B | 0 | 86153 | 0 |
| C | 0 | 82609 | 0 |
| D | 0 | 140348 | 0 |
| Mode M9 | |||
|---|---|---|---|
| Quadrant | BADHDUFLAG | Total packets | Discarded packets |
| A | 0 | 121 | 0 |
| B | 0 | 121 | 0 |
| C | 0 | 121 | 0 |
| D | 0 | 121 | 0 |
| Quadrant | Total seconds | Saturated seconds | Saturation percentage |
|---|---|---|---|
| A | 39643 | 354 | 0.892970% |
| B | 39643 | 484 | 1.220897% |
| C | 39643 | 64 | 0.161441% |
| D | 39643 | 2282 | 5.756376% |
Noise dominated data is calculated using 1-second bins in cleaned event files. If a bin has >2000 counts, and if more than 50% of those come from <1% of pixels, then it is considered to be noise-dominated and hence unusable.
| Quadrant | # 1 sec bins | Bins with >0 counts | Bins with >2000 counts | High rate bins dominated by noise | Noise dominated (total time) | Noise dominated (detector-on time) | Marked lightcurve |
|---|---|---|---|---|---|---|---|
| A | 51677 | 39642 | 0 | 0 | 0.00% | 0.00% |  |
| B | 51677 | 39622 | 0 | 0 | 0.00% | 0.00% | 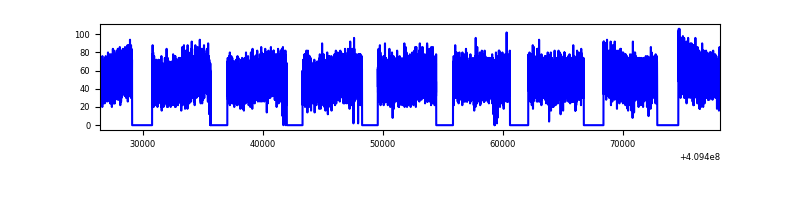 |
| C | 51677 | 39643 | 0 | 0 | 0.00% | 0.00% | 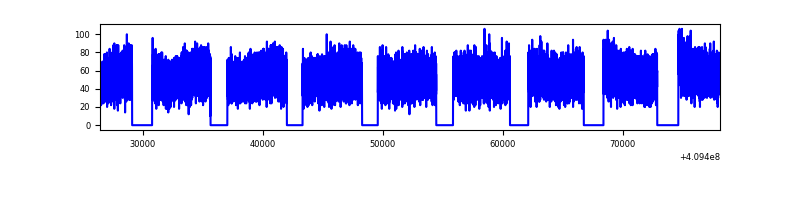 |
| D | 51677 | 39638 | 0 | 0 | 0.00% | 0.00% | 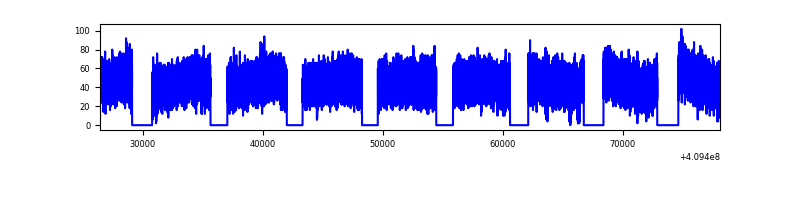 |
Top three noisy pixels from each quadrant. If the there are fewer than three noisy pixels in the level2.evt file, extra rows are filled as -1
| Pixel properties | Quadrant properties | ||||||
|---|---|---|---|---|---|---|---|
| Quadrant | DetID | PixID | Counts | Sigma | Mean | Median | Sigma |
| A | 0 | 29 | 1748 | 8.76 | 555 | 520 | 140.2 |
| A | 7 | 110 | 1744 | 8.73 | 555 | 520 | 140.2 |
| A | 9 | 19 | 1721 | 8.56 | 555 | 520 | 140.2 |
| B | 2 | 9 | 1758 | 11.85 | 537 | 514 | 105.0 |
| B | 3 | 80 | 1645 | 10.77 | 537 | 514 | 105.0 |
| B | 3 | 17 | 1437 | 8.79 | 537 | 514 | 105.0 |
| C | 1 | 81 | 1747 | 8.73 | 550 | 514 | 141.3 |
| C | 1 | 80 | 1651 | 8.05 | 550 | 514 | 141.3 |
| C | 3 | 202 | 1566 | 7.45 | 550 | 514 | 141.3 |
| D | 7 | 3 | 1324 | 6.48 | 501 | 458 | 133.7 |
| D | 4 | 160 | 1297 | 6.28 | 501 | 458 | 133.7 |
| D | 10 | 189 | 1289 | 6.22 | 501 | 458 | 133.7 |
Histogram calculated using DETX and DETY for each event in the final _common_clean file
| Quadrant A | 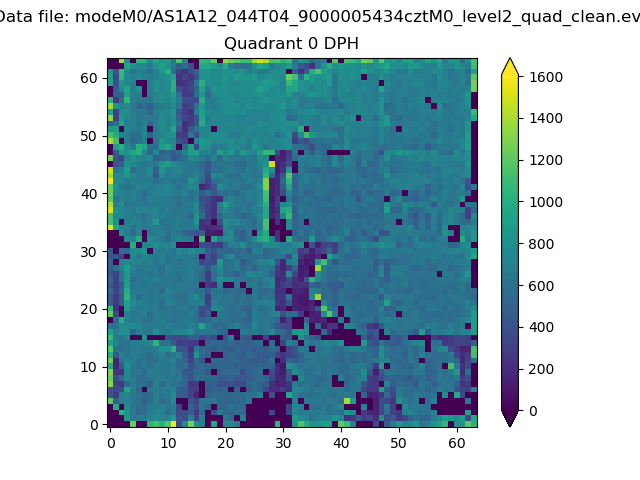 |
 |
Quadrant B |
|---|---|---|---|
| Quadrant D |  |
 |
Quadrant C |
| Plot type | Count rate plots | Images |
|---|---|---|
| Comparison with Poisson distribution Blue bars denote a histogram of data divided into 1 sec bins. Red curve is a Poisson curve with rate = median count rate of data. |
 |
 |
| Quadrant-wise count rates Data is divided into 100 sec bins |
 |
|
| Module-wise count rates for Quadrant A Data is divided into 100 sec bins |
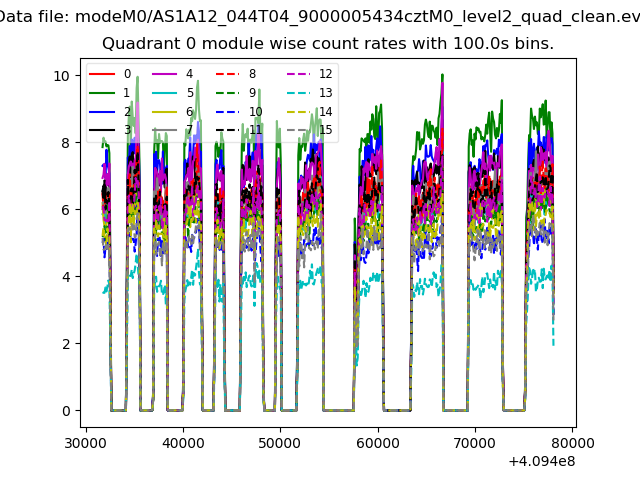 |
 |
| Module-wise count rates for Quadrant B Data is divided into 100 sec bins |
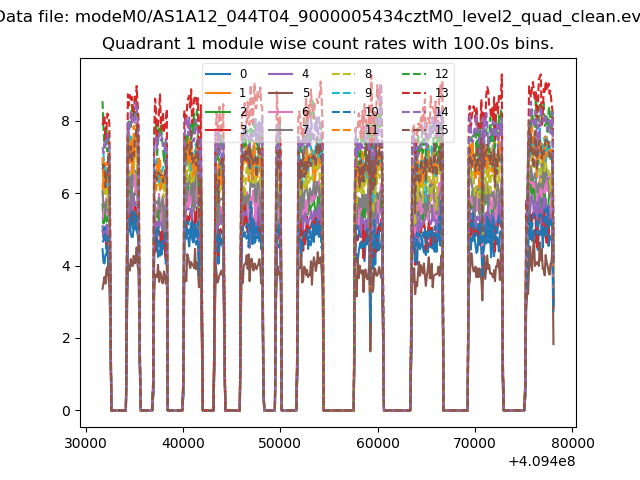 |
 |
| Module-wise count rates for Quadrant C Data is divided into 100 sec bins |
 |
 |
| Module-wise count rates for Quadrant D Data is divided into 100 sec bins |
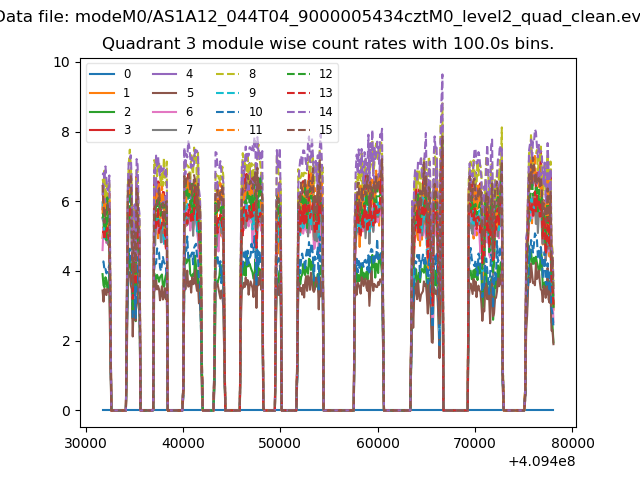 |
 |
| Parameter | Plot |
|---|---|
| CZT HV Monitor |  |
| D_VDD |  |
| Temperature 1 |  |
| Veto HV Monitor | 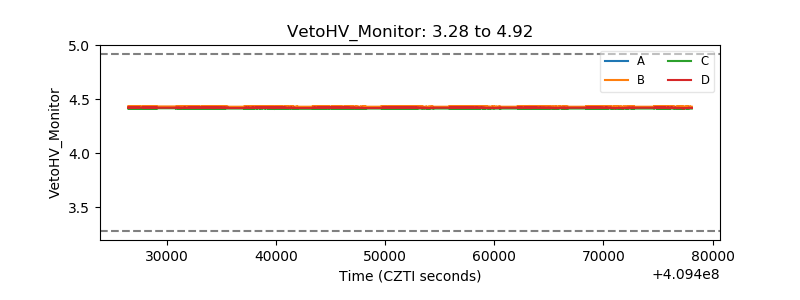 |
| Veto LLD |  |
| Alpha Counter |  |
| _CPM_Rate |  |
| CZT Counter | 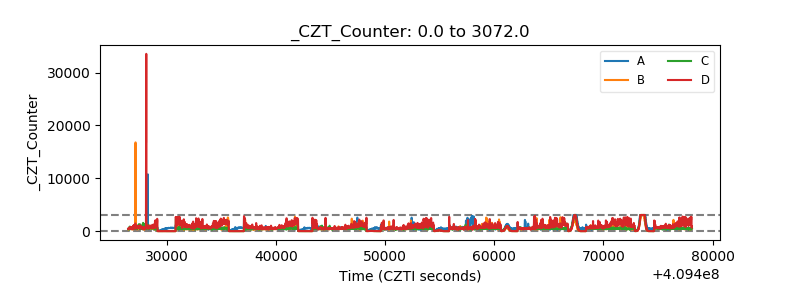 |
| +2.5 Volts monitor |  |
| +5 Volts monitor |  |
| _ROLL_ROT | 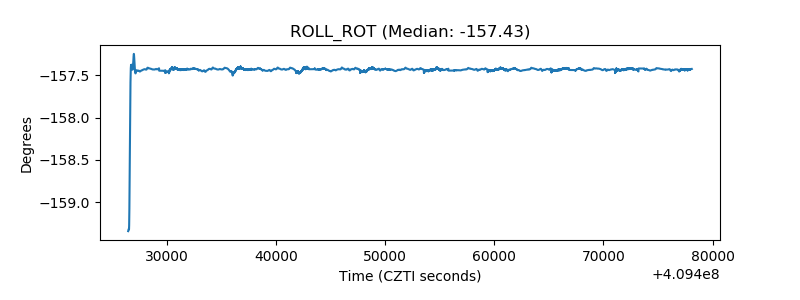 |
| _Roll_DEC | 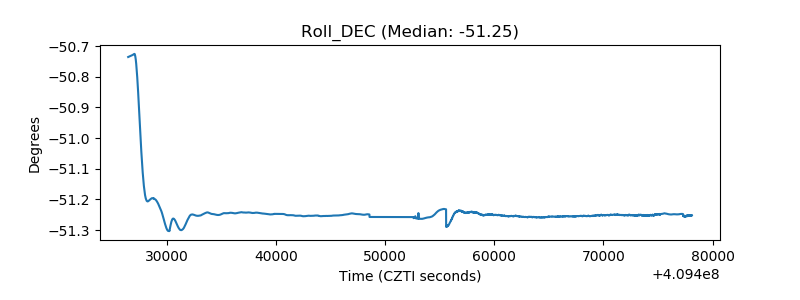 |
| _Roll_RA | 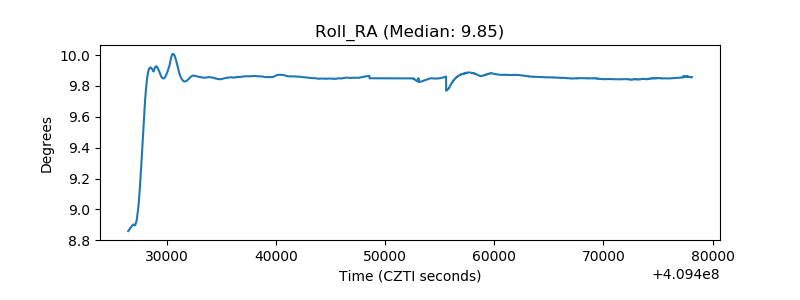 |
| Veto Counter |  |