| Param | Original file | Final file |
|---|---|---|
| Filename | modeM0/AS1A12_077T06_9000005430cztM0_level2.fits | modeM0/AS1A12_077T06_9000005430cztM0_level2_quad_clean.evt |
| Size (bytes) | 1,229,950,080 | 1,328,581,440 |
| Size | 1.1 GB | 1.2 GB |
| Events in quadrant A | 6,639,232 | 6,765,842 |
| Events in quadrant B | 7,367,300 | 8,600,329 |
| Events in quadrant C | 7,450,032 | 8,117,606 |
| Events in quadrant D | 6,442,580 | 7,422,179 |
| Mode M9 | |||
|---|---|---|---|
| Quadrant | BADHDUFLAG | Total packets | Discarded packets |
| A | 0 | 515 | 0 |
| B | 0 | 515 | 0 |
| C | 0 | 515 | 0 |
| D | 0 | 515 | 0 |
| Mode M0 | |||
|---|---|---|---|
| Quadrant | BADHDUFLAG | Total packets | Discarded packets |
| A | 0 | 599701 | 0 |
| B | 0 | 280782 | 0 |
| C | 0 | 323176 | 0 |
| D | 0 | 378122 | 0 |
| Mode SS | |||
|---|---|---|---|
| Quadrant | BADHDUFLAG | Total packets | Discarded packets |
| A | 0 | 2780 | 0 |
| B | 0 | 2780 | 0 |
| C | 0 | 2780 | 0 |
| D | 0 | 2780 | 0 |
| Quadrant | Total seconds | Saturated seconds | Saturation percentage |
|---|---|---|---|
| A | 136205 | 33402 | 24.523329% |
| B | 136208 | 398 | 0.292200% |
| C | 136208 | 3053 | 2.241425% |
| D | 136209 | 6079 | 4.462994% |
Noise dominated data is calculated using 1-second bins in cleaned event files. If a bin has >2000 counts, and if more than 50% of those come from <1% of pixels, then it is considered to be noise-dominated and hence unusable.
| Quadrant | # 1 sec bins | Bins with >0 counts | Bins with >2000 counts | High rate bins dominated by noise | Noise dominated (total time) | Noise dominated (detector-on time) | Marked lightcurve |
|---|---|---|---|---|---|---|---|
| A | 192852 | 135970 | 0 | 0 | 0.00% | 0.00% |  |
| B | 192853 | 136200 | 0 | 0 | 0.00% | 0.00% | 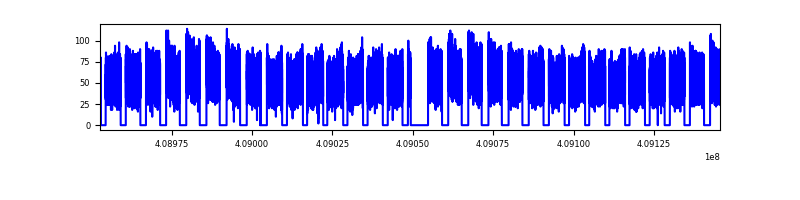 |
| C | 192852 | 136114 | 0 | 0 | 0.00% | 0.00% |  |
| D | 192853 | 136130 | 0 | 0 | 0.00% | 0.00% | 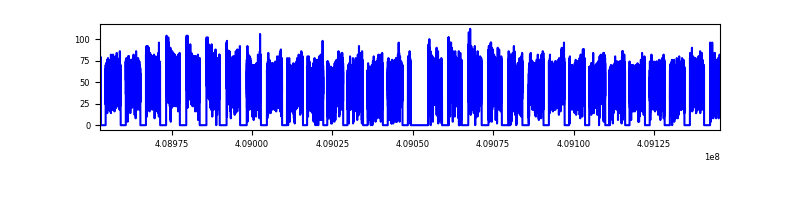 |
Top three noisy pixels from each quadrant. If the there are fewer than three noisy pixels in the level2.evt file, extra rows are filled as -1
| Pixel properties | Quadrant properties | ||||||
|---|---|---|---|---|---|---|---|
| Quadrant | DetID | PixID | Counts | Sigma | Mean | Median | Sigma |
| A | 9 | 19 | 5586 | 9.35 | 1733 | 1629 | 423.2 |
| A | 7 | 110 | 5515 | 9.18 | 1733 | 1629 | 423.2 |
| A | 0 | 29 | 5231 | 8.51 | 1733 | 1629 | 423.2 |
| B | 2 | 9 | 6515 | 12.16 | 1950 | 1856 | 383.1 |
| B | 3 | 80 | 5735 | 10.13 | 1950 | 1856 | 383.1 |
| B | 2 | 8 | 5222 | 8.79 | 1950 | 1856 | 383.1 |
| C | 1 | 81 | 6204 | 8.67 | 1972 | 1851 | 502.3 |
| C | 1 | 80 | 5907 | 8.08 | 1972 | 1851 | 502.3 |
| C | 3 | 202 | 5903 | 8.07 | 1972 | 1851 | 502.3 |
| D | 4 | 160 | 4732 | 6.28 | 1845 | 1685 | 485.1 |
| D | 7 | 3 | 4683 | 6.18 | 1845 | 1685 | 485.1 |
| D | 6 | 38 | 4561 | 5.93 | 1845 | 1685 | 485.1 |
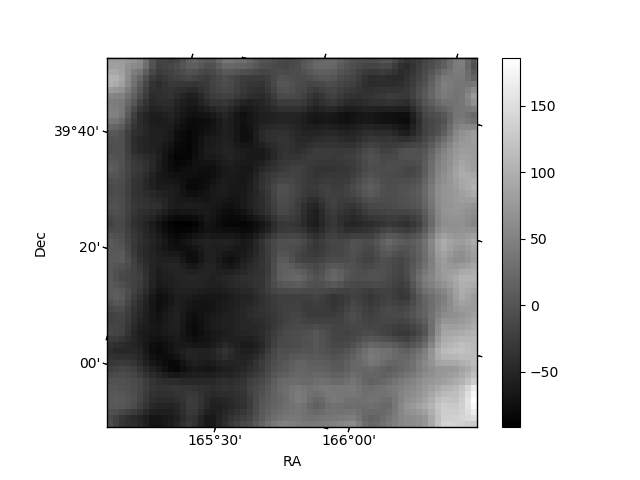
Histogram calculated using DETX and DETY for each event in the final _common_clean file
| Quadrant A | 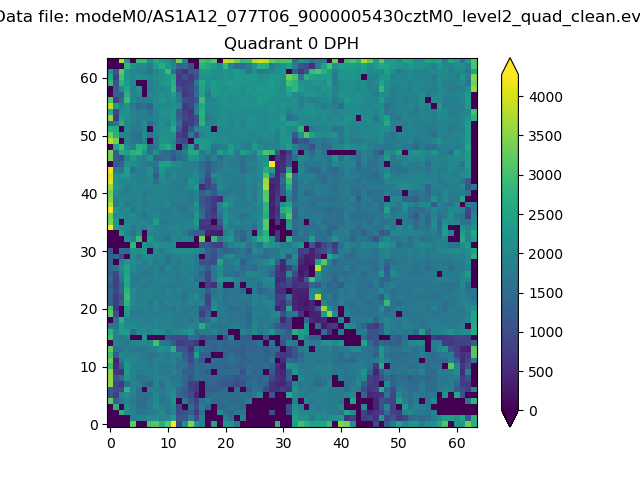 |
 |
Quadrant B |
|---|---|---|---|
| Quadrant D |  |
 |
Quadrant C |
| Plot type | Count rate plots | Images |
|---|---|---|
| Comparison with Poisson distribution Blue bars denote a histogram of data divided into 1 sec bins. Red curve is a Poisson curve with rate = median count rate of data. |
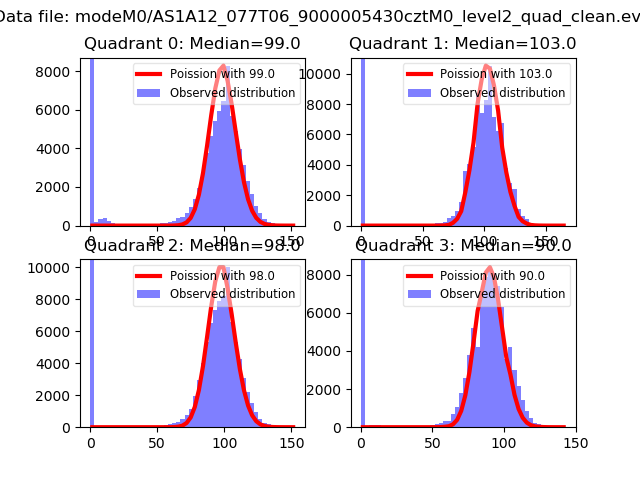 |
 |
| Quadrant-wise count rates Data is divided into 100 sec bins |
 |
|
| Module-wise count rates for Quadrant A Data is divided into 100 sec bins |
 |
 |
| Module-wise count rates for Quadrant B Data is divided into 100 sec bins |
 |
 |
| Module-wise count rates for Quadrant C Data is divided into 100 sec bins |
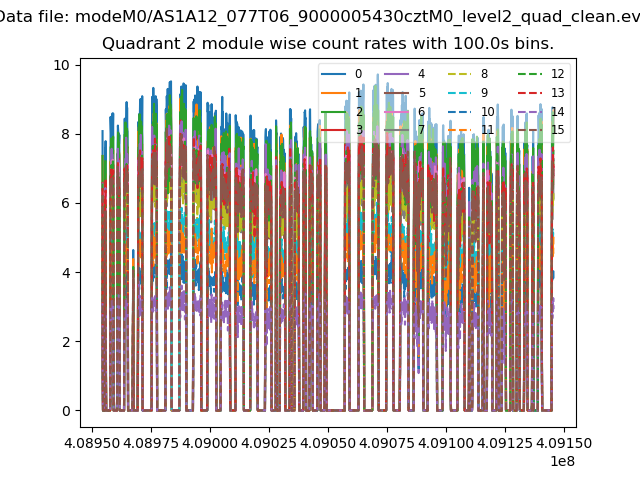 |
 |
| Module-wise count rates for Quadrant D Data is divided into 100 sec bins |
 |
 |
| Parameter | Plot |
|---|---|
| CZT HV Monitor |  |
| D_VDD |  |
| Temperature 1 |  |
| Veto HV Monitor |  |
| Veto LLD |  |
| Alpha Counter |  |
| _CPM_Rate |  |
| CZT Counter |  |
| +2.5 Volts monitor |  |
| +5 Volts monitor |  |
| _ROLL_ROT |  |
| _Roll_DEC |  |
| _Roll_RA |  |
| Veto Counter | 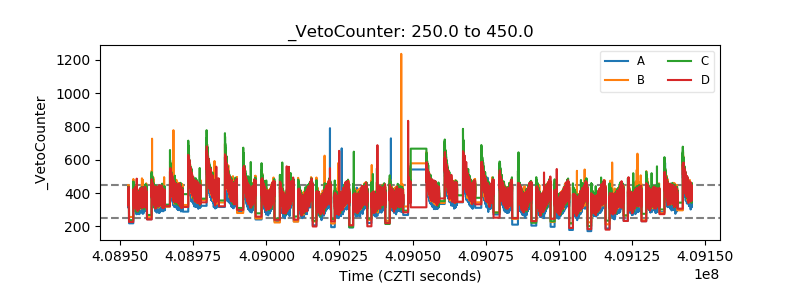 |