| Param | Original file | Final file |
|---|---|---|
| Filename | modeM0/AS1C07_001T02_9000005426cztM0_level2.fits | modeM0/AS1C07_001T02_9000005426cztM0_level2_quad_clean.evt |
| Size (bytes) | 432,757,440 | 640,440,000 |
| Size | 412.7 MB | 610.8 MB |
| Events in quadrant A | 2,569,576 | 4,167,354 |
| Events in quadrant B | 2,498,760 | 4,257,798 |
| Events in quadrant C | 2,583,472 | 4,057,299 |
| Events in quadrant D | 2,226,128 | 3,688,510 |
| Mode M0 | |||
|---|---|---|---|
| Quadrant | BADHDUFLAG | Total packets | Discarded packets |
| A | 0 | 117687 | 0 |
| B | 0 | 97663 | 0 |
| C | 0 | 95674 | 0 |
| D | 0 | 116126 | 0 |
| Mode M9 | |||
|---|---|---|---|
| Quadrant | BADHDUFLAG | Total packets | Discarded packets |
| A | 0 | 188 | 0 |
| B | 0 | 188 | 0 |
| C | 0 | 188 | 0 |
| D | 0 | 188 | 0 |
| Mode SS | |||
|---|---|---|---|
| Quadrant | BADHDUFLAG | Total packets | Discarded packets |
| A | 0 | 960 | 0 |
| B | 0 | 960 | 0 |
| C | 0 | 960 | 0 |
| D | 0 | 960 | 0 |
| Quadrant | Total seconds | Saturated seconds | Saturation percentage |
|---|---|---|---|
| A | 47037 | 1129 | 2.400238% |
| B | 47037 | 267 | 0.567638% |
| C | 47037 | 97 | 0.206221% |
| D | 47037 | 1349 | 2.867955% |
Noise dominated data is calculated using 1-second bins in cleaned event files. If a bin has >2000 counts, and if more than 50% of those come from <1% of pixels, then it is considered to be noise-dominated and hence unusable.
| Quadrant | # 1 sec bins | Bins with >0 counts | Bins with >2000 counts | High rate bins dominated by noise | Noise dominated (total time) | Noise dominated (detector-on time) | Marked lightcurve |
|---|---|---|---|---|---|---|---|
| A | 63672 | 46973 | 0 | 0 | 0.00% | 0.00% |  |
| B | 63672 | 47007 | 0 | 0 | 0.00% | 0.00% | 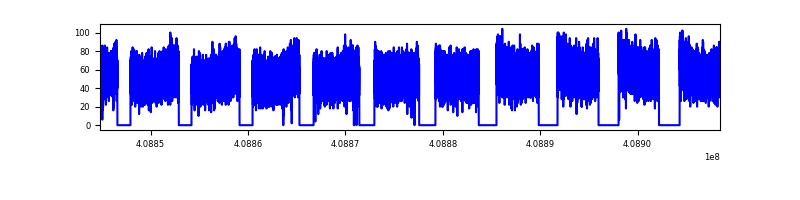 |
| C | 63672 | 47027 | 0 | 0 | 0.00% | 0.00% |  |
| D | 63672 | 46992 | 0 | 0 | 0.00% | 0.00% |  |
Top three noisy pixels from each quadrant. If the there are fewer than three noisy pixels in the level2.evt file, extra rows are filled as -1
| Pixel properties | Quadrant properties | ||||||
|---|---|---|---|---|---|---|---|
| Quadrant | DetID | PixID | Counts | Sigma | Mean | Median | Sigma |
| A | 9 | 19 | 2116 | 8.76 | 671 | 631 | 169.6 |
| A | 0 | 29 | 2106 | 8.7 | 671 | 631 | 169.6 |
| A | 7 | 110 | 2088 | 8.59 | 671 | 631 | 169.6 |
| B | 2 | 9 | 2173 | 11.87 | 660 | 630 | 130.0 |
| B | 3 | 17 | 1794 | 8.96 | 660 | 630 | 130.0 |
| B | 5 | 128 | 1758 | 8.68 | 660 | 630 | 130.0 |
| C | 1 | 81 | 2137 | 8.46 | 683 | 642 | 176.8 |
| C | 1 | 80 | 2051 | 7.97 | 683 | 642 | 176.8 |
| C | 1 | 65 | 1810 | 6.61 | 683 | 642 | 176.8 |
| D | 4 | 160 | 1714 | 6.73 | 637 | 585 | 167.8 |
| D | 7 | 3 | 1680 | 6.53 | 637 | 585 | 167.8 |
| D | 6 | 231 | 1604 | 6.07 | 637 | 585 | 167.8 |
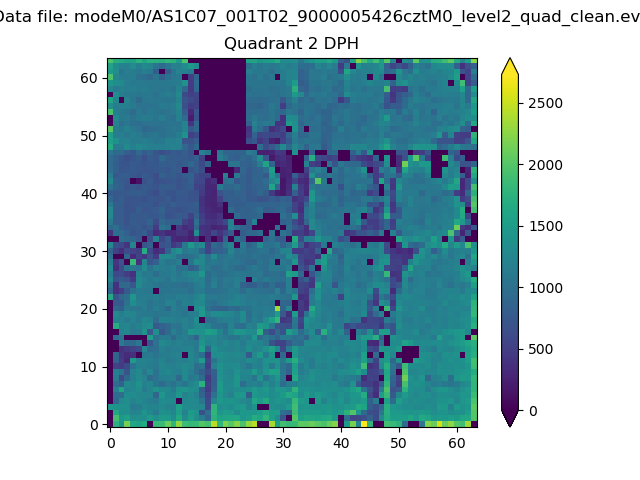
Histogram calculated using DETX and DETY for each event in the final _common_clean file
| Quadrant A |  |
 |
Quadrant B |
|---|---|---|---|
| Quadrant D | 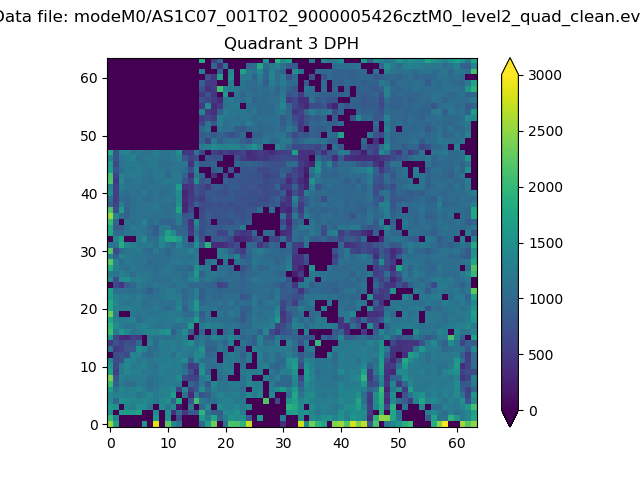 |
 |
Quadrant C |
| Plot type | Count rate plots | Images |
|---|---|---|
| Comparison with Poisson distribution Blue bars denote a histogram of data divided into 1 sec bins. Red curve is a Poisson curve with rate = median count rate of data. |
 |
 |
| Quadrant-wise count rates Data is divided into 100 sec bins |
 |
|
| Module-wise count rates for Quadrant A Data is divided into 100 sec bins |
 |
 |
| Module-wise count rates for Quadrant B Data is divided into 100 sec bins |
 |
 |
| Module-wise count rates for Quadrant C Data is divided into 100 sec bins |
 |
 |
| Module-wise count rates for Quadrant D Data is divided into 100 sec bins |
 |
 |
| Parameter | Plot |
|---|---|
| CZT HV Monitor |  |
| D_VDD | 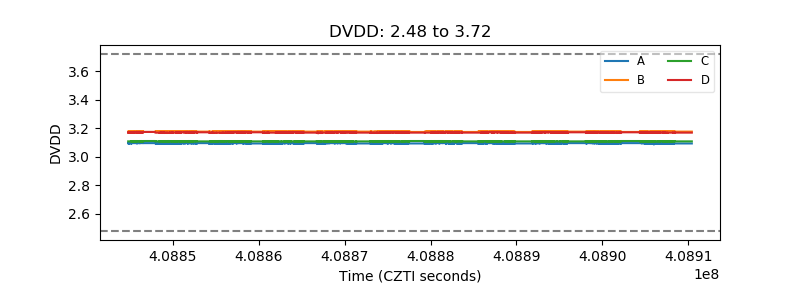 |
| Temperature 1 |  |
| Veto HV Monitor |  |
| Veto LLD |  |
| Alpha Counter |  |
| _CPM_Rate |  |
| CZT Counter |  |
| +2.5 Volts monitor | 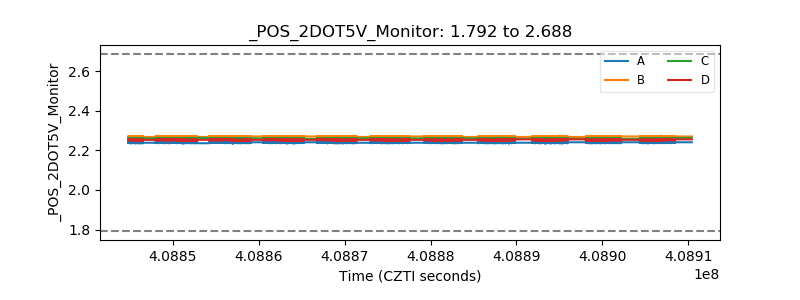 |
| +5 Volts monitor |  |
| _ROLL_ROT |  |
| _Roll_DEC |  |
| _Roll_RA |  |
| Veto Counter |  |