| Param | Original file | Final file |
|---|---|---|
| Filename | modeM0/AS1A12_042T01_9000005428cztM0_level2.fits | modeM0/AS1A12_042T01_9000005428cztM0_level2_quad_clean.evt |
| Size (bytes) | 283,380,480 | 439,971,840 |
| Size | 270.3 MB | 419.6 MB |
| Events in quadrant A | 1,624,570 | 2,743,219 |
| Events in quadrant B | 1,628,248 | 2,953,844 |
| Events in quadrant C | 1,670,316 | 2,826,875 |
| Events in quadrant D | 1,457,376 | 2,601,571 |
| Mode M0 | |||
|---|---|---|---|
| Quadrant | BADHDUFLAG | Total packets | Discarded packets |
| A | 0 | 109921 | 0 |
| B | 0 | 65649 | 0 |
| C | 0 | 67424 | 0 |
| D | 0 | 72999 | 0 |
| Mode SS | |||
|---|---|---|---|
| Quadrant | BADHDUFLAG | Total packets | Discarded packets |
| A | 0 | 650 | 0 |
| B | 0 | 650 | 0 |
| C | 0 | 650 | 0 |
| D | 0 | 650 | 0 |
| Mode M9 | |||
|---|---|---|---|
| Quadrant | BADHDUFLAG | Total packets | Discarded packets |
| A | 0 | 93 | 0 |
| B | 0 | 93 | 0 |
| C | 0 | 93 | 0 |
| D | 0 | 93 | 0 |
| Quadrant | Total seconds | Saturated seconds | Saturation percentage |
|---|---|---|---|
| A | 32035 | 2239 | 6.989231% |
| B | 32035 | 99 | 0.309037% |
| C | 32035 | 116 | 0.362104% |
| D | 32035 | 399 | 1.245513% |
Noise dominated data is calculated using 1-second bins in cleaned event files. If a bin has >2000 counts, and if more than 50% of those come from <1% of pixels, then it is considered to be noise-dominated and hence unusable.
| Quadrant | # 1 sec bins | Bins with >0 counts | Bins with >2000 counts | High rate bins dominated by noise | Noise dominated (total time) | Noise dominated (detector-on time) | Marked lightcurve |
|---|---|---|---|---|---|---|---|
| A | 41203 | 32025 | 0 | 0 | 0.00% | 0.00% |  |
| B | 41203 | 32029 | 0 | 0 | 0.00% | 0.00% |  |
| C | 41203 | 32033 | 0 | 0 | 0.00% | 0.00% |  |
| D | 41203 | 32023 | 0 | 0 | 0.00% | 0.00% | 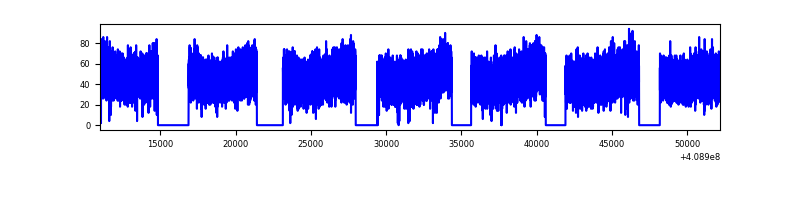 |
Top three noisy pixels from each quadrant. If the there are fewer than three noisy pixels in the level2.evt file, extra rows are filled as -1
| Pixel properties | Quadrant properties | ||||||
|---|---|---|---|---|---|---|---|
| Quadrant | DetID | PixID | Counts | Sigma | Mean | Median | Sigma |
| A | 0 | 29 | 1360 | 8.94 | 423 | 398 | 107.6 |
| A | 9 | 19 | 1334 | 8.7 | 423 | 398 | 107.6 |
| A | 7 | 110 | 1334 | 8.7 | 423 | 398 | 107.6 |
| B | 2 | 9 | 1428 | 11.7 | 430 | 411 | 86.9 |
| B | 3 | 80 | 1271 | 9.89 | 430 | 411 | 86.9 |
| B | 2 | 8 | 1151 | 8.51 | 430 | 411 | 86.9 |
| C | 1 | 81 | 1426 | 8.84 | 441 | 415 | 114.4 |
| C | 1 | 80 | 1414 | 8.74 | 441 | 415 | 114.4 |
| C | 1 | 65 | 1207 | 6.93 | 441 | 415 | 114.4 |
| D | 7 | 3 | 1086 | 6.33 | 415 | 378 | 111.9 |
| D | 3 | 14 | 1063 | 6.12 | 415 | 378 | 111.9 |
| D | 10 | 113 | 1056 | 6.06 | 415 | 378 | 111.9 |
Histogram calculated using DETX and DETY for each event in the final _common_clean file
| Quadrant A |  |
 |
Quadrant B |
|---|---|---|---|
| Quadrant D |  |
 |
Quadrant C |
| Plot type | Count rate plots | Images |
|---|---|---|
| Comparison with Poisson distribution Blue bars denote a histogram of data divided into 1 sec bins. Red curve is a Poisson curve with rate = median count rate of data. |
 |
 |
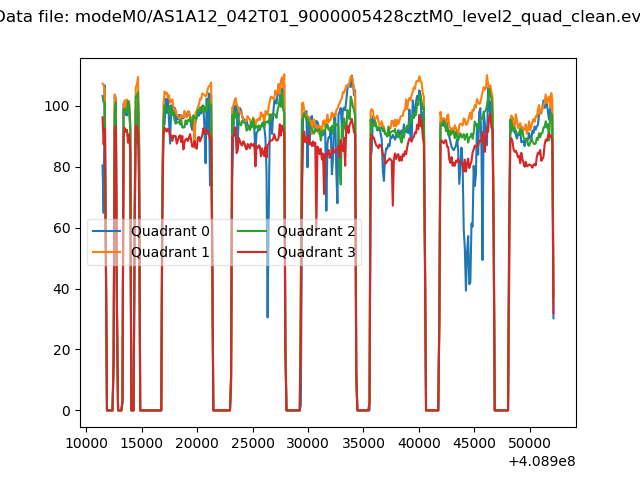
| Quadrant-wise count rates Data is divided into 100 sec bins |
 |
|
| Module-wise count rates for Quadrant A Data is divided into 100 sec bins |
 |
 |
| Module-wise count rates for Quadrant B Data is divided into 100 sec bins |
 |
 |
| Module-wise count rates for Quadrant C Data is divided into 100 sec bins |
 |
 |
| Module-wise count rates for Quadrant D Data is divided into 100 sec bins |
 |
 |
| Parameter | Plot |
|---|---|
| CZT HV Monitor |  |
| D_VDD |  |
| Temperature 1 |  |
| Veto HV Monitor |  |
| Veto LLD | 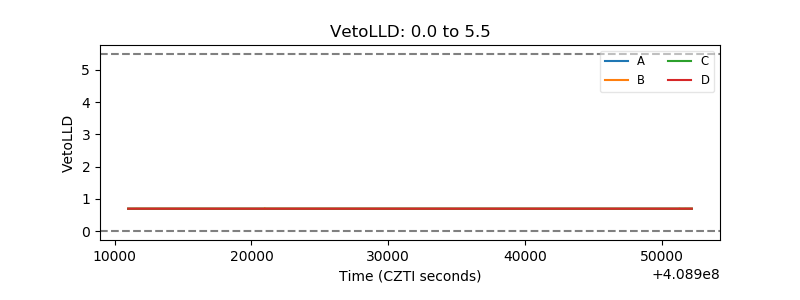 |
| Alpha Counter |  |
| _CPM_Rate |  |
| CZT Counter |  |
| +2.5 Volts monitor |  |
| +5 Volts monitor | 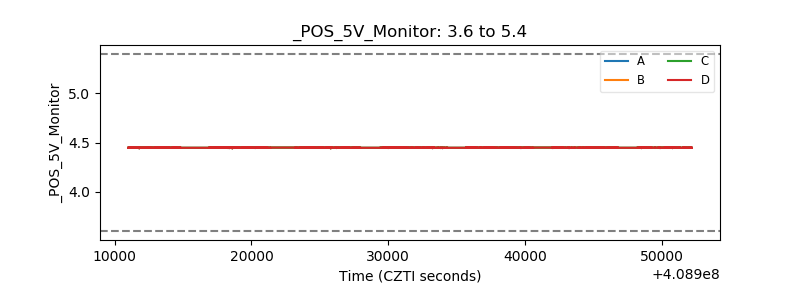 |
| _ROLL_ROT |  |
| _Roll_DEC |  |
| _Roll_RA |  |
| Veto Counter |  |