| Param | Original file | Final file |
|---|---|---|
| Filename | modeM0/AS1T05_064T01_9000005416cztM0_level2.fits | modeM0/AS1T05_064T01_9000005416cztM0_level2_quad_clean.evt |
| Size (bytes) | 2,856,576,960 | 3,218,618,880 |
| Size | 2.7 GB | 3.0 GB |
| Events in quadrant A | 17,220,452 | 20,203,791 |
| Events in quadrant B | 16,606,208 | 20,187,136 |
| Events in quadrant C | 17,085,682 | 19,256,406 |
| Events in quadrant D | 13,948,016 | 16,198,409 |
| Mode SS | |||
|---|---|---|---|
| Quadrant | BADHDUFLAG | Total packets | Discarded packets |
| A | 0 | 6452 | 0 |
| B | 0 | 6452 | 0 |
| C | 0 | 6452 | 0 |
| D | 0 | 6452 | 0 |
| Mode M9 | |||
|---|---|---|---|
| Quadrant | BADHDUFLAG | Total packets | Discarded packets |
| A | 0 | 1209 | 0 |
| B | 0 | 1209 | 0 |
| C | 0 | 1209 | 0 |
| D | 0 | 1209 | 0 |
| Mode M0 | |||
|---|---|---|---|
| Quadrant | BADHDUFLAG | Total packets | Discarded packets |
| A | 0 | 713660 | 0 |
| B | 0 | 670368 | 0 |
| C | 0 | 676655 | 0 |
| D | 0 | 1103503 | 0 |
| Quadrant | Total seconds | Saturated seconds | Saturation percentage |
|---|---|---|---|
| A | 315969 | 3060 | 0.968449% |
| B | 315965 | 2960 | 0.936813% |
| C | 315964 | 2388 | 0.755782% |
| D | 315966 | 31963 | 10.115962% |
Noise dominated data is calculated using 1-second bins in cleaned event files. If a bin has >2000 counts, and if more than 50% of those come from <1% of pixels, then it is considered to be noise-dominated and hence unusable.
| Quadrant | # 1 sec bins | Bins with >0 counts | Bins with >2000 counts | High rate bins dominated by noise | Noise dominated (total time) | Noise dominated (detector-on time) | Marked lightcurve |
|---|---|---|---|---|---|---|---|
| A | 436509 | 315936 | 0 | 0 | 0.00% | 0.00% |  |
| B | 436508 | 315896 | 0 | 0 | 0.00% | 0.00% |  |
| C | 436509 | 315912 | 0 | 0 | 0.00% | 0.00% |  |
| D | 436509 | 315397 | 0 | 0 | 0.00% | 0.00% |  |
Top three noisy pixels from each quadrant. If the there are fewer than three noisy pixels in the level2.evt file, extra rows are filled as -1
| Pixel properties | Quadrant properties | ||||||
|---|---|---|---|---|---|---|---|
| Quadrant | DetID | PixID | Counts | Sigma | Mean | Median | Sigma |
| A | 9 | 19 | 14258 | 8.96 | 4501 | 4228 | 1119.5 |
| A | 7 | 110 | 14040 | 8.76 | 4501 | 4228 | 1119.5 |
| A | 0 | 29 | 13753 | 8.51 | 4501 | 4228 | 1119.5 |
| B | 2 | 9 | 14436 | 12.15 | 4396 | 4198 | 842.6 |
| B | 3 | 80 | 13047 | 10.5 | 4396 | 4198 | 842.6 |
| B | 5 | 255 | 11780 | 9.0 | 4396 | 4198 | 842.6 |
| C | 1 | 81 | 14471 | 8.98 | 4518 | 4248 | 1138.1 |
| C | 1 | 80 | 13786 | 8.38 | 4518 | 4248 | 1138.1 |
| C | 3 | 202 | 13439 | 8.08 | 4518 | 4248 | 1138.1 |
| D | 7 | 3 | 10290 | 6.32 | 3997 | 3648 | 1050.9 |
| D | 4 | 160 | 10171 | 6.21 | 3997 | 3648 | 1050.9 |
| D | 10 | 189 | 10101 | 6.14 | 3997 | 3648 | 1050.9 |
Histogram calculated using DETX and DETY for each event in the final _common_clean file
| Quadrant A |  |
 |
Quadrant B |
|---|---|---|---|
| Quadrant D |  |
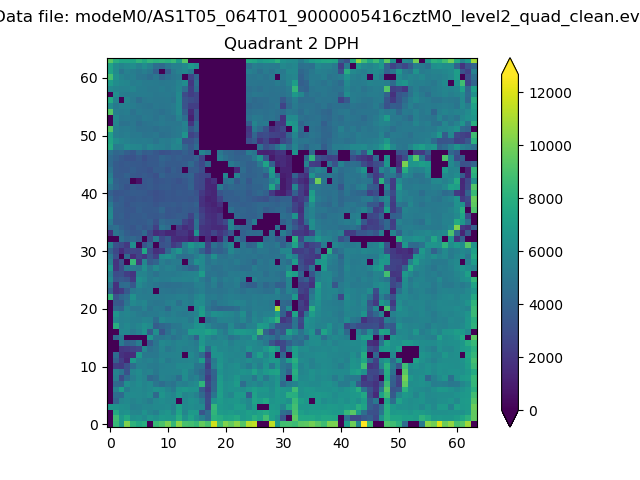 |
Quadrant C |
| Plot type | Count rate plots | Images |
|---|---|---|
| Comparison with Poisson distribution Blue bars denote a histogram of data divided into 1 sec bins. Red curve is a Poisson curve with rate = median count rate of data. |
 |
 |
| Quadrant-wise count rates Data is divided into 100 sec bins |
 |
|
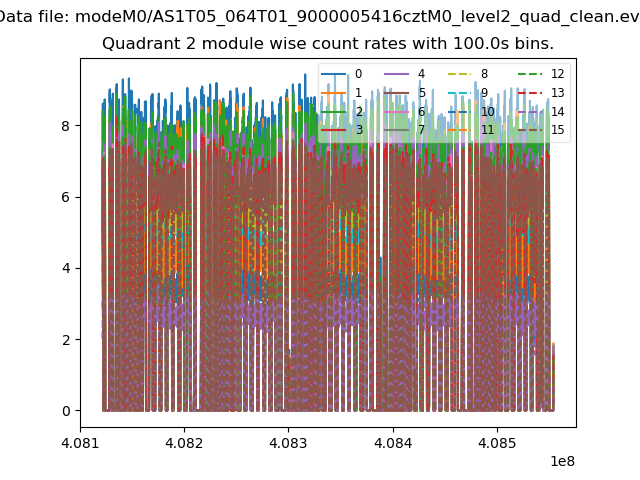
| Module-wise count rates for Quadrant A Data is divided into 100 sec bins |
 |
 |
| Module-wise count rates for Quadrant B Data is divided into 100 sec bins |
 |
 |
| Module-wise count rates for Quadrant C Data is divided into 100 sec bins |
 |
 |
| Module-wise count rates for Quadrant D Data is divided into 100 sec bins |
 |
 |
| Parameter | Plot |
|---|---|
| CZT HV Monitor |  |
| D_VDD | 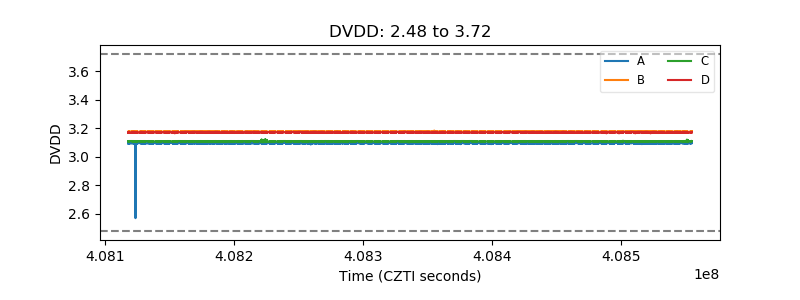 |
| Temperature 1 |  |
| Veto HV Monitor |  |
| Veto LLD |  |
| Alpha Counter |  |
| _CPM_Rate |  |
| CZT Counter | 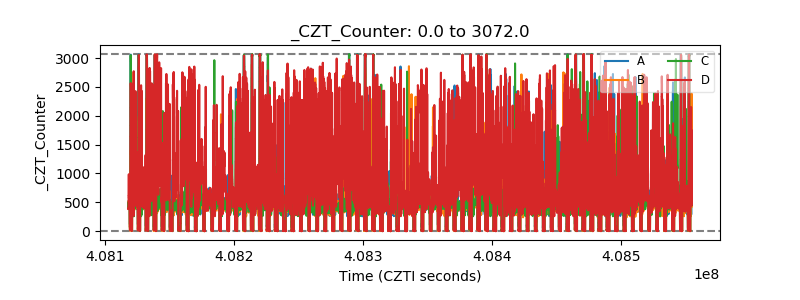 |
| +2.5 Volts monitor |  |
| +5 Volts monitor |  |
| _ROLL_ROT |  |
| _Roll_DEC |  |
| _Roll_RA |  |
| Veto Counter |  |