| Param | Original file | Final file |
|---|---|---|
| Filename | modeM0/AS1A12_093T01_9000005410cztM0_level2.fits | modeM0/AS1A12_093T01_9000005410cztM0_level2_quad_clean.evt |
| Size (bytes) | 217,287,360 | 240,540,480 |
| Size | 207.2 MB | 229.4 MB |
| Events in quadrant A | 1,276,940 | 1,423,730 |
| Events in quadrant B | 1,254,518 | 1,484,481 |
| Events in quadrant C | 1,299,312 | 1,434,754 |
| Events in quadrant D | 1,109,284 | 1,301,518 |
| Mode SS | |||
|---|---|---|---|
| Quadrant | BADHDUFLAG | Total packets | Discarded packets |
| A | 0 | 484 | 0 |
| B | 0 | 484 | 0 |
| C | 0 | 484 | 0 |
| D | 0 | 484 | 0 |
| Mode M0 | |||
|---|---|---|---|
| Quadrant | BADHDUFLAG | Total packets | Discarded packets |
| A | 0 | 64626 | 0 |
| B | 0 | 51668 | 0 |
| C | 0 | 48556 | 0 |
| D | 0 | 64552 | 0 |
| Mode M9 | |||
|---|---|---|---|
| Quadrant | BADHDUFLAG | Total packets | Discarded packets |
| A | 0 | 96 | 0 |
| B | 0 | 96 | 0 |
| C | 0 | 96 | 0 |
| D | 0 | 96 | 0 |
| Quadrant | Total seconds | Saturated seconds | Saturation percentage |
|---|---|---|---|
| A | 23843 | 1640 | 6.878329% |
| B | 23843 | 182 | 0.763327% |
| C | 23843 | 25 | 0.104853% |
| D | 23843 | 721 | 3.023948% |
Noise dominated data is calculated using 1-second bins in cleaned event files. If a bin has >2000 counts, and if more than 50% of those come from <1% of pixels, then it is considered to be noise-dominated and hence unusable.
| Quadrant | # 1 sec bins | Bins with >0 counts | Bins with >2000 counts | High rate bins dominated by noise | Noise dominated (total time) | Noise dominated (detector-on time) | Marked lightcurve |
|---|---|---|---|---|---|---|---|
| A | 32206 | 23838 | 0 | 0 | 0.00% | 0.00% | 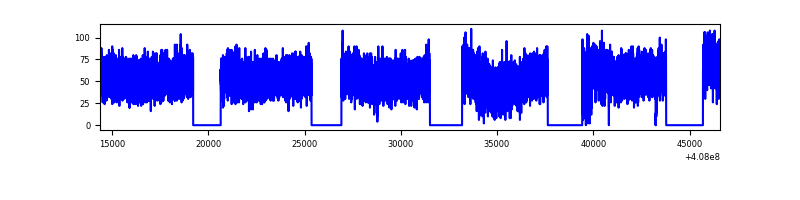 |
| B | 32206 | 23841 | 0 | 0 | 0.00% | 0.00% |  |
| C | 32206 | 23842 | 0 | 0 | 0.00% | 0.00% |  |
| D | 32206 | 23838 | 0 | 0 | 0.00% | 0.00% |  |
Top three noisy pixels from each quadrant. If the there are fewer than three noisy pixels in the level2.evt file, extra rows are filled as -1
| Pixel properties | Quadrant properties | ||||||
|---|---|---|---|---|---|---|---|
| Quadrant | DetID | PixID | Counts | Sigma | Mean | Median | Sigma |
| A | 9 | 19 | 1079 | 8.96 | 332 | 313 | 85.5 |
| A | 7 | 110 | 1014 | 8.2 | 332 | 313 | 85.5 |
| A | 0 | 29 | 1002 | 8.06 | 332 | 313 | 85.5 |
| B | 2 | 9 | 1021 | 10.6 | 331 | 316 | 66.5 |
| B | 5 | 128 | 904 | 8.84 | 331 | 316 | 66.5 |
| B | 3 | 17 | 897 | 8.73 | 331 | 316 | 66.5 |
| C | 1 | 81 | 1059 | 8.18 | 343 | 321 | 90.2 |
| C | 1 | 80 | 1054 | 8.13 | 343 | 321 | 90.2 |
| C | 3 | 202 | 1021 | 7.76 | 343 | 321 | 90.2 |
| D | 4 | 160 | 825 | 6.27 | 317 | 289 | 85.5 |
| D | 6 | 38 | 824 | 6.25 | 317 | 289 | 85.5 |
| D | 10 | 189 | 820 | 6.21 | 317 | 289 | 85.5 |
Histogram calculated using DETX and DETY for each event in the final _common_clean file
| Quadrant A | 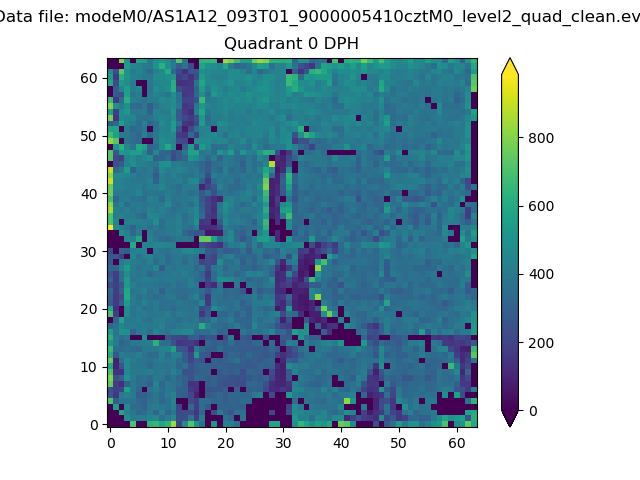 |
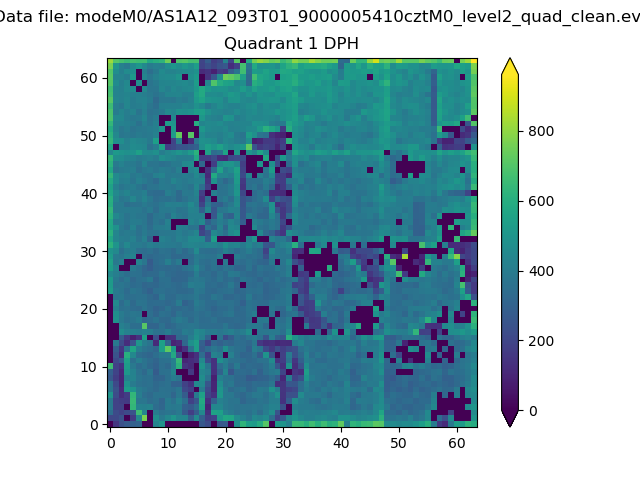 |
Quadrant B |
|---|---|---|---|
| Quadrant D |  |
 |
Quadrant C |
| Plot type | Count rate plots | Images |
|---|---|---|
| Comparison with Poisson distribution Blue bars denote a histogram of data divided into 1 sec bins. Red curve is a Poisson curve with rate = median count rate of data. |
 |
 |
| Quadrant-wise count rates Data is divided into 100 sec bins |
 |
|
| Module-wise count rates for Quadrant A Data is divided into 100 sec bins |
 |
 |
| Module-wise count rates for Quadrant B Data is divided into 100 sec bins |
 |
 |
| Module-wise count rates for Quadrant C Data is divided into 100 sec bins |
 |
 |
| Module-wise count rates for Quadrant D Data is divided into 100 sec bins |
 |
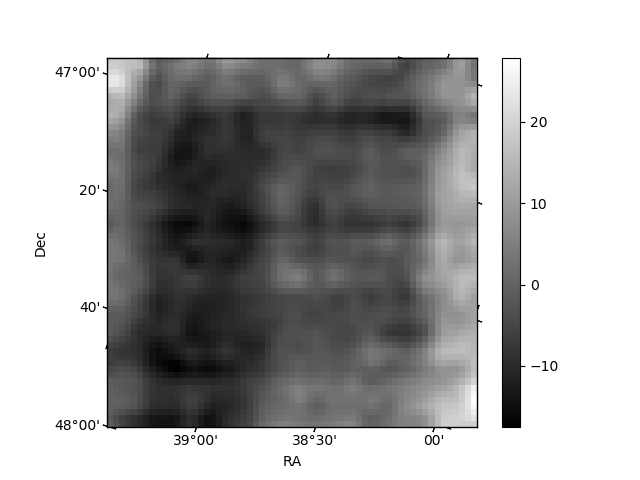 |
| Parameter | Plot |
|---|---|
| CZT HV Monitor |  |
| D_VDD | 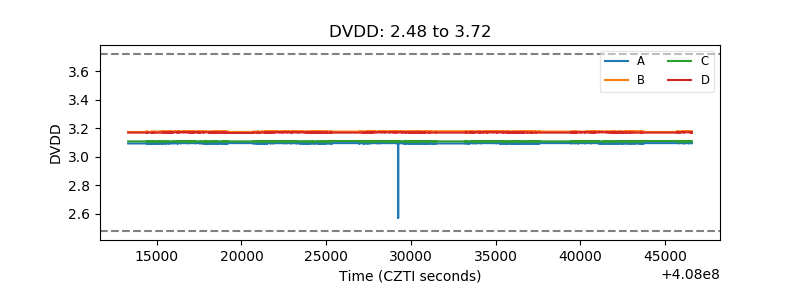 |
| Temperature 1 |  |
| Veto HV Monitor | 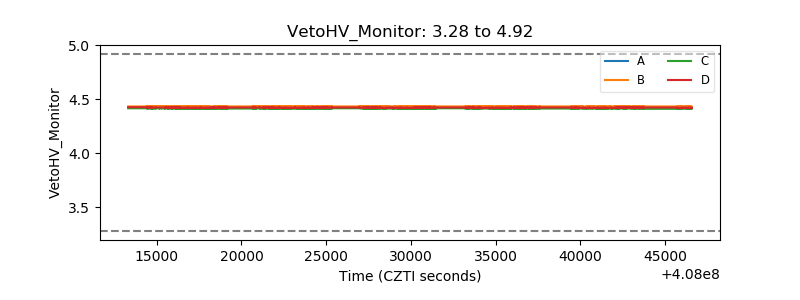 |
| Veto LLD |  |
| Alpha Counter | 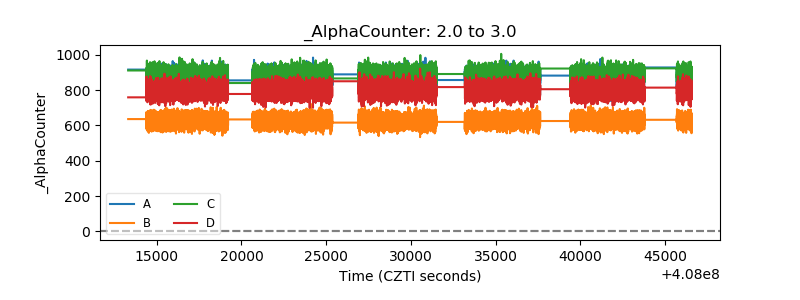 |
| _CPM_Rate |  |
| CZT Counter | 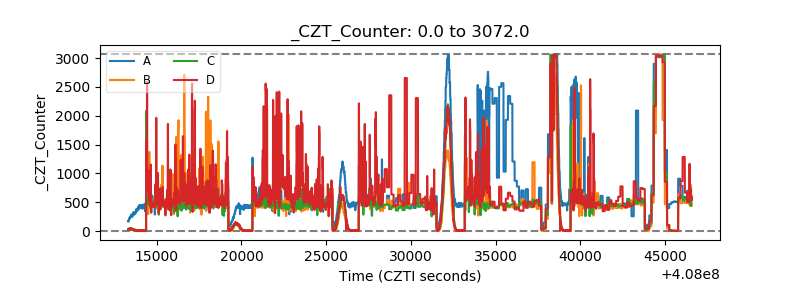 |
| +2.5 Volts monitor |  |
| +5 Volts monitor |  |
| _ROLL_ROT |  |
| _Roll_DEC |  |
| _Roll_RA |  |
| Veto Counter |  |