| Param | Original file | Final file |
|---|---|---|
| Filename | modeM0/AS1A12_061T07_9000005402cztM0_level2.fits | modeM0/AS1A12_061T07_9000005402cztM0_level2_quad_clean.evt |
| Size (bytes) | 575,513,280 | 594,751,680 |
| Size | 548.9 MB | 567.2 MB |
| Events in quadrant A | 3,446,284 | 3,606,375 |
| Events in quadrant B | 3,355,420 | 3,624,478 |
| Events in quadrant C | 3,419,632 | 3,383,782 |
| Events in quadrant D | 2,899,836 | 3,089,430 |
| Mode M9 | |||
|---|---|---|---|
| Quadrant | BADHDUFLAG | Total packets | Discarded packets |
| A | 0 | 244 | 0 |
| B | 0 | 244 | 0 |
| C | 0 | 244 | 0 |
| D | 0 | 244 | 0 |
| Mode SS | |||
|---|---|---|---|
| Quadrant | BADHDUFLAG | Total packets | Discarded packets |
| A | 0 | 1280 | 0 |
| B | 0 | 1280 | 0 |
| C | 0 | 1280 | 0 |
| D | 0 | 1280 | 0 |
| Mode M0 | |||
|---|---|---|---|
| Quadrant | BADHDUFLAG | Total packets | Discarded packets |
| A | 0 | 140035 | 0 |
| B | 0 | 128313 | 0 |
| C | 0 | 130663 | 0 |
| D | 0 | 174436 | 0 |
| Quadrant | Total seconds | Saturated seconds | Saturation percentage |
|---|---|---|---|
| A | 62830 | 292 | 0.464746% |
| B | 62830 | 151 | 0.240331% |
| C | 62830 | 248 | 0.394716% |
| D | 62830 | 1633 | 2.599077% |
Noise dominated data is calculated using 1-second bins in cleaned event files. If a bin has >2000 counts, and if more than 50% of those come from <1% of pixels, then it is considered to be noise-dominated and hence unusable.
| Quadrant | # 1 sec bins | Bins with >0 counts | Bins with >2000 counts | High rate bins dominated by noise | Noise dominated (total time) | Noise dominated (detector-on time) | Marked lightcurve |
|---|---|---|---|---|---|---|---|
| A | 87086 | 62830 | 0 | 0 | 0.00% | 0.00% | 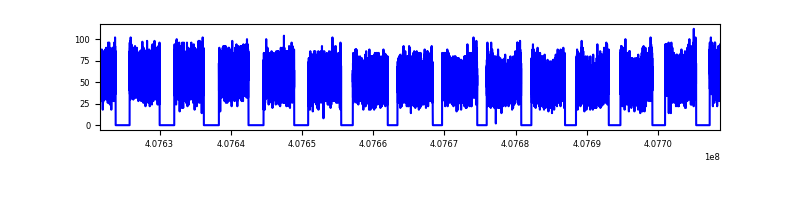 |
| B | 87086 | 62830 | 0 | 0 | 0.00% | 0.00% |  |
| C | 87086 | 62830 | 0 | 0 | 0.00% | 0.00% |  |
| D | 87086 | 62817 | 0 | 0 | 0.00% | 0.00% |  |
Top three noisy pixels from each quadrant. If the there are fewer than three noisy pixels in the level2.evt file, extra rows are filled as -1
| Pixel properties | Quadrant properties | ||||||
|---|---|---|---|---|---|---|---|
| Quadrant | DetID | PixID | Counts | Sigma | Mean | Median | Sigma |
| A | 0 | 29 | 2793 | 8.53 | 899 | 841 | 228.8 |
| A | 7 | 110 | 2787 | 8.51 | 899 | 841 | 228.8 |
| A | 9 | 19 | 2719 | 8.21 | 899 | 841 | 228.8 |
| B | 2 | 9 | 2886 | 11.77 | 886 | 844 | 173.6 |
| B | 3 | 80 | 2617 | 10.22 | 886 | 844 | 173.6 |
| B | 2 | 8 | 2364 | 8.76 | 886 | 844 | 173.6 |
| C | 1 | 81 | 2766 | 8.27 | 902 | 848 | 231.9 |
| C | 3 | 202 | 2729 | 8.11 | 902 | 848 | 231.9 |
| C | 1 | 80 | 2698 | 7.98 | 902 | 848 | 231.9 |
| D | 4 | 160 | 2138 | 6.26 | 828 | 756 | 220.7 |
| D | 7 | 3 | 2085 | 6.02 | 828 | 756 | 220.7 |
| D | 1 | 3 | 2065 | 5.93 | 828 | 756 | 220.7 |
Histogram calculated using DETX and DETY for each event in the final _common_clean file
| Quadrant A |  |
 |
Quadrant B |
|---|---|---|---|
| Quadrant D |  |
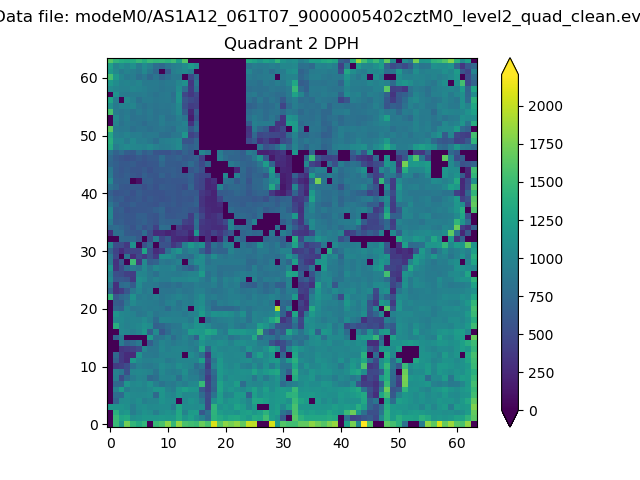 |
Quadrant C |
| Plot type | Count rate plots | Images |
|---|---|---|
| Comparison with Poisson distribution Blue bars denote a histogram of data divided into 1 sec bins. Red curve is a Poisson curve with rate = median count rate of data. |
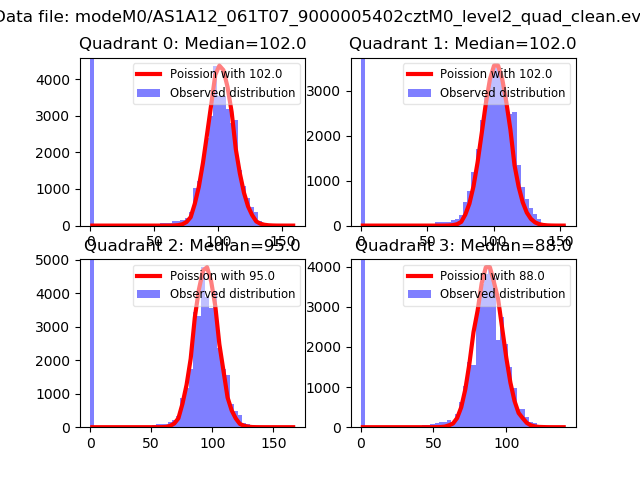 |
 |
| Quadrant-wise count rates Data is divided into 100 sec bins |
 |
|
| Module-wise count rates for Quadrant A Data is divided into 100 sec bins |
 |
 |
| Module-wise count rates for Quadrant B Data is divided into 100 sec bins |
 |
 |
| Module-wise count rates for Quadrant C Data is divided into 100 sec bins |
 |
 |
| Module-wise count rates for Quadrant D Data is divided into 100 sec bins |
 |
 |
| Parameter | Plot |
|---|---|
| CZT HV Monitor |  |
| D_VDD |  |
| Temperature 1 |  |
| Veto HV Monitor |  |
| Veto LLD |  |
| Alpha Counter |  |
| _CPM_Rate |  |
| CZT Counter |  |
| +2.5 Volts monitor |  |
| +5 Volts monitor |  |
| _ROLL_ROT |  |
| _Roll_DEC |  |
| _Roll_RA |  |
| Veto Counter |  |