| Param | Original file | Final file |
|---|---|---|
| Filename | modeM0/AS1A12_054T01_9000005392cztM0_level2.fits | modeM0/AS1A12_054T01_9000005392cztM0_level2_quad_clean.evt |
| Size (bytes) | 3,830,132,160 | 4,013,104,320 |
| Size | 3.6 GB | 3.7 GB |
| Events in quadrant A | 23,504,616 | 25,316,808 |
| Events in quadrant B | 22,420,872 | 24,942,516 |
| Events in quadrant C | 23,081,852 | 24,084,464 |
| Events in quadrant D | 17,591,492 | 17,858,138 |
| Mode M9 | |||
|---|---|---|---|
| Quadrant | BADHDUFLAG | Total packets | Discarded packets |
| A | 0 | 1614 | 0 |
| B | 0 | 1614 | 0 |
| C | 0 | 1614 | 0 |
| D | 0 | 1614 | 0 |
| Mode SS | |||
|---|---|---|---|
| Quadrant | BADHDUFLAG | Total packets | Discarded packets |
| A | 0 | 8762 | 0 |
| B | 0 | 8762 | 0 |
| C | 0 | 8762 | 0 |
| D | 0 | 8762 | 0 |
| Mode M0 | |||
|---|---|---|---|
| Quadrant | BADHDUFLAG | Total packets | Discarded packets |
| A | 0 | 968270 | 0 |
| B | 0 | 1024339 | 0 |
| C | 0 | 914807 | 0 |
| D | 0 | 1951248 | 0 |
| Quadrant | Total seconds | Saturated seconds | Saturation percentage |
|---|---|---|---|
| A | 428407 | 5071 | 1.183687% |
| B | 428407 | 14646 | 3.418712% |
| C | 428407 | 2649 | 0.618337% |
| D | 428407 | 114911 | 26.822858% |
Noise dominated data is calculated using 1-second bins in cleaned event files. If a bin has >2000 counts, and if more than 50% of those come from <1% of pixels, then it is considered to be noise-dominated and hence unusable.
| Quadrant | # 1 sec bins | Bins with >0 counts | Bins with >2000 counts | High rate bins dominated by noise | Noise dominated (total time) | Noise dominated (detector-on time) | Marked lightcurve |
|---|---|---|---|---|---|---|---|
| A | 590051 | 428377 | 0 | 0 | 0.00% | 0.00% |  |
| B | 590051 | 428123 | 0 | 0 | 0.00% | 0.00% |  |
| C | 590051 | 428372 | 0 | 0 | 0.00% | 0.00% |  |
| D | 590050 | 427675 | 0 | 0 | 0.00% | 0.00% | 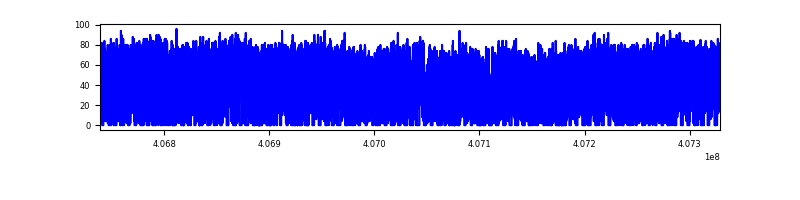 |
Top three noisy pixels from each quadrant. If the there are fewer than three noisy pixels in the level2.evt file, extra rows are filled as -1
| Pixel properties | Quadrant properties | ||||||
|---|---|---|---|---|---|---|---|
| Quadrant | DetID | PixID | Counts | Sigma | Mean | Median | Sigma |
| A | 7 | 110 | 19276 | 8.92 | 6143 | 5752 | 1515.5 |
| A | 0 | 29 | 19058 | 8.78 | 6143 | 5752 | 1515.5 |
| A | 9 | 19 | 18984 | 8.73 | 6143 | 5752 | 1515.5 |
| B | 2 | 9 | 19439 | 11.74 | 5939 | 5651 | 1174.0 |
| B | 3 | 80 | 17618 | 10.19 | 5939 | 5651 | 1174.0 |
| B | 5 | 255 | 15538 | 8.42 | 5939 | 5651 | 1174.0 |
| C | 1 | 81 | 19084 | 8.71 | 6110 | 5729 | 1532.8 |
| C | 1 | 80 | 18559 | 8.37 | 6110 | 5729 | 1532.8 |
| C | 3 | 202 | 18317 | 8.21 | 6110 | 5729 | 1532.8 |
| D | 7 | 3 | 13010 | 6.29 | 5044 | 4589 | 1339.2 |
| D | 10 | 113 | 12836 | 6.16 | 5044 | 4589 | 1339.2 |
| D | 4 | 160 | 12688 | 6.05 | 5044 | 4589 | 1339.2 |
Histogram calculated using DETX and DETY for each event in the final _common_clean file
| Quadrant A |  |
 |
Quadrant B |
|---|---|---|---|
| Quadrant D |  |
 |
Quadrant C |
| Plot type | Count rate plots | Images |
|---|---|---|
| Comparison with Poisson distribution Blue bars denote a histogram of data divided into 1 sec bins. Red curve is a Poisson curve with rate = median count rate of data. |
 |
 |
| Quadrant-wise count rates Data is divided into 100 sec bins |
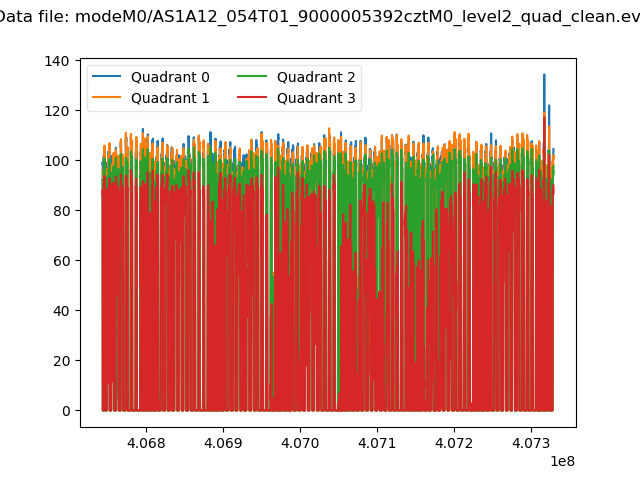 |
|
| Module-wise count rates for Quadrant A Data is divided into 100 sec bins |
 |
 |
| Module-wise count rates for Quadrant B Data is divided into 100 sec bins |
 |
 |
| Module-wise count rates for Quadrant C Data is divided into 100 sec bins |
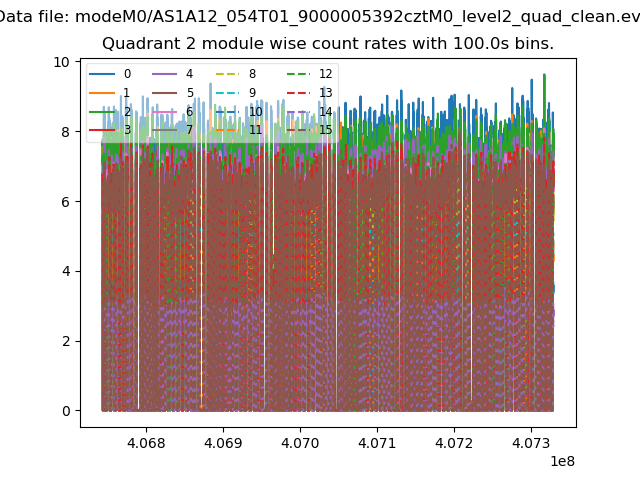 |
 |
| Module-wise count rates for Quadrant D Data is divided into 100 sec bins |
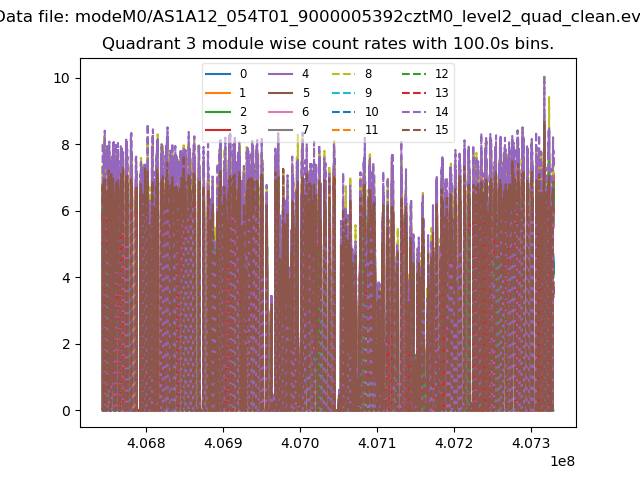 |
 |
| Parameter | Plot |
|---|---|
| CZT HV Monitor |  |
| D_VDD |  |
| Temperature 1 |  |
| Veto HV Monitor | 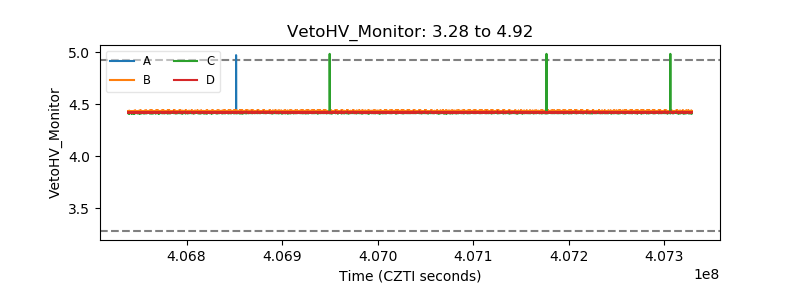 |
| Veto LLD |  |
| Alpha Counter |  |
| _CPM_Rate |  |
| CZT Counter |  |
| +2.5 Volts monitor |  |
| +5 Volts monitor | 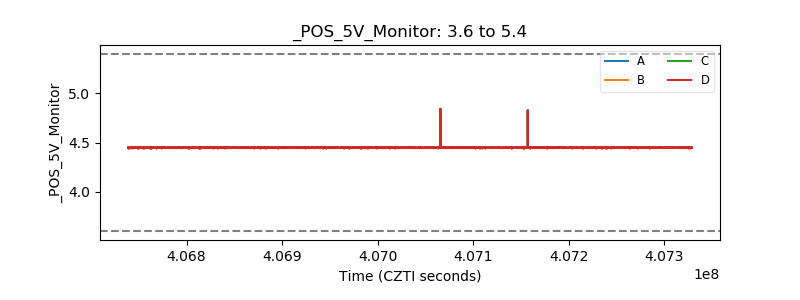 |
| _ROLL_ROT |  |
| _Roll_DEC |  |
| _Roll_RA |  |
| Veto Counter | 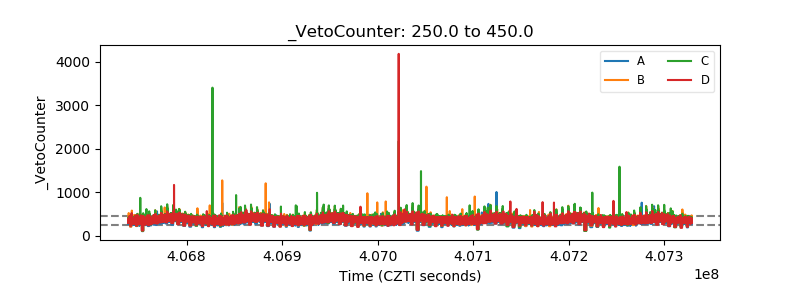 |