| Param | Original file | Final file |
|---|---|---|
| Filename | modeM0/AS1A12_061T03_9000005390cztM0_level2.fits | modeM0/AS1A12_061T03_9000005390cztM0_level2_quad_clean.evt |
| Size (bytes) | 1,201,541,760 | 1,163,177,280 |
| Size | 1.1 GB | 1.1 GB |
| Events in quadrant A | 7,296,096 | 6,947,331 |
| Events in quadrant B | 7,000,026 | 6,979,852 |
| Events in quadrant C | 7,243,762 | 6,710,146 |
| Events in quadrant D | 5,870,424 | 5,617,816 |
| Mode SS | |||
|---|---|---|---|
| Quadrant | BADHDUFLAG | Total packets | Discarded packets |
| A | 0 | 2674 | 0 |
| B | 0 | 2674 | 0 |
| C | 0 | 2674 | 0 |
| D | 0 | 2674 | 0 |
| Mode M9 | |||
|---|---|---|---|
| Quadrant | BADHDUFLAG | Total packets | Discarded packets |
| A | 0 | 494 | 0 |
| B | 0 | 494 | 0 |
| C | 0 | 494 | 0 |
| D | 0 | 494 | 0 |
| Mode M0 | |||
|---|---|---|---|
| Quadrant | BADHDUFLAG | Total packets | Discarded packets |
| A | 0 | 299680 | 0 |
| B | 0 | 296945 | 0 |
| C | 0 | 282049 | 0 |
| D | 0 | 424125 | 0 |
| Quadrant | Total seconds | Saturated seconds | Saturation percentage |
|---|---|---|---|
| A | 130945 | 1440 | 1.099698% |
| B | 130945 | 1901 | 1.451755% |
| C | 130945 | 902 | 0.688839% |
| D | 130945 | 14862 | 11.349803% |
Noise dominated data is calculated using 1-second bins in cleaned event files. If a bin has >2000 counts, and if more than 50% of those come from <1% of pixels, then it is considered to be noise-dominated and hence unusable.
| Quadrant | # 1 sec bins | Bins with >0 counts | Bins with >2000 counts | High rate bins dominated by noise | Noise dominated (total time) | Noise dominated (detector-on time) | Marked lightcurve |
|---|---|---|---|---|---|---|---|
| A | 180178 | 130879 | 0 | 0 | 0.00% | 0.00% | 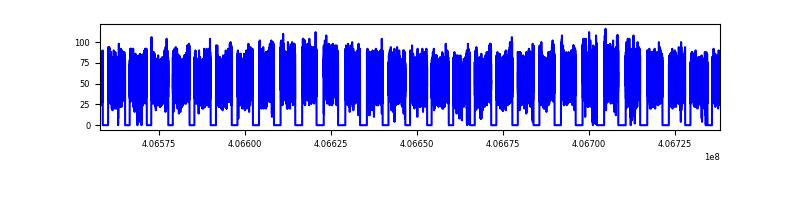 |
| B | 180178 | 130938 | 0 | 0 | 0.00% | 0.00% |  |
| C | 180178 | 130938 | 0 | 0 | 0.00% | 0.00% |  |
| D | 180177 | 130503 | 0 | 0 | 0.00% | 0.00% |  |
Top three noisy pixels from each quadrant. If the there are fewer than three noisy pixels in the level2.evt file, extra rows are filled as -1
| Pixel properties | Quadrant properties | ||||||
|---|---|---|---|---|---|---|---|
| Quadrant | DetID | PixID | Counts | Sigma | Mean | Median | Sigma |
| A | 7 | 110 | 6076 | 9.16 | 1907 | 1786 | 468.1 |
| A | 9 | 19 | 5945 | 8.88 | 1907 | 1786 | 468.1 |
| A | 0 | 29 | 5794 | 8.56 | 1907 | 1786 | 468.1 |
| B | 2 | 9 | 6058 | 11.83 | 1857 | 1770 | 362.3 |
| B | 3 | 80 | 5447 | 10.15 | 1857 | 1770 | 362.3 |
| B | 2 | 8 | 5021 | 8.97 | 1857 | 1770 | 362.3 |
| C | 1 | 81 | 5955 | 8.7 | 1916 | 1799 | 477.8 |
| C | 1 | 80 | 5833 | 8.44 | 1916 | 1799 | 477.8 |
| C | 3 | 202 | 5795 | 8.36 | 1916 | 1799 | 477.8 |
| D | 7 | 3 | 4388 | 6.42 | 1684 | 1537 | 444.0 |
| D | 10 | 189 | 4309 | 6.24 | 1684 | 1537 | 444.0 |
| D | 10 | 113 | 4245 | 6.1 | 1684 | 1537 | 444.0 |
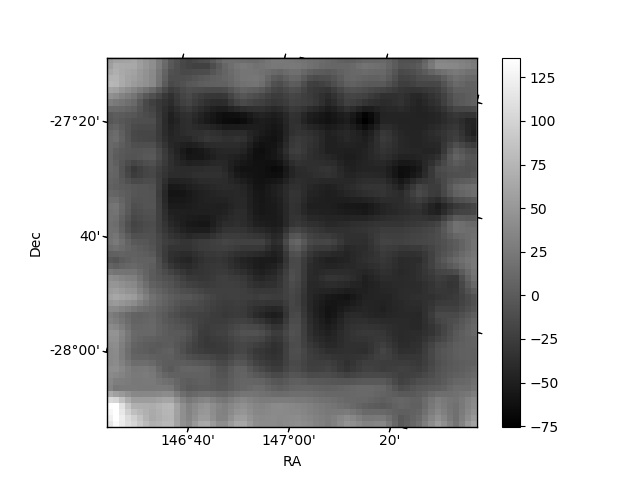
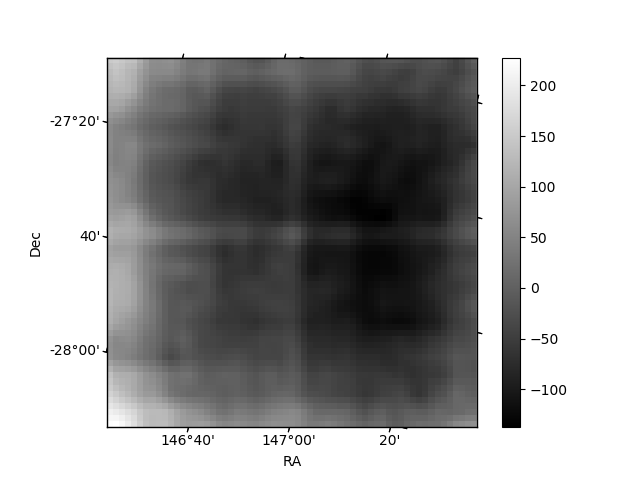
Histogram calculated using DETX and DETY for each event in the final _common_clean file
| Quadrant A |  |
 |
Quadrant B |
|---|---|---|---|
| Quadrant D |  |
 |
Quadrant C |
| Plot type | Count rate plots | Images |
|---|---|---|
| Comparison with Poisson distribution Blue bars denote a histogram of data divided into 1 sec bins. Red curve is a Poisson curve with rate = median count rate of data. |
 |
 |
| Quadrant-wise count rates Data is divided into 100 sec bins |
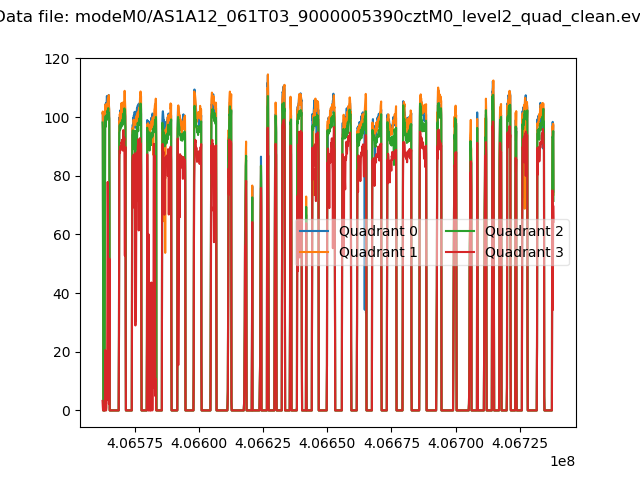 |
|
| Module-wise count rates for Quadrant A Data is divided into 100 sec bins |
 |
 |
| Module-wise count rates for Quadrant B Data is divided into 100 sec bins |
 |
 |
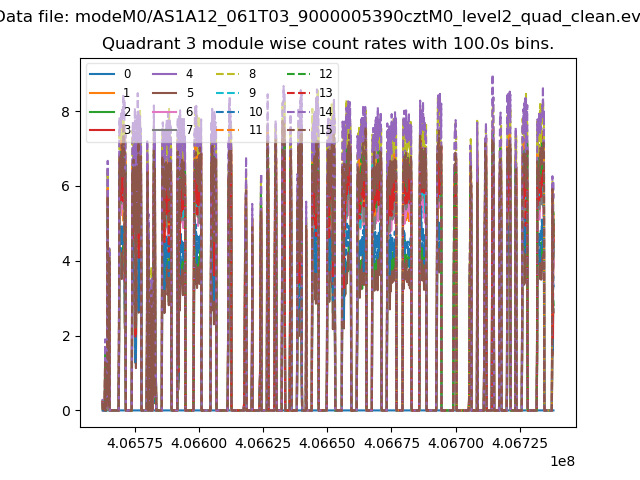
| Module-wise count rates for Quadrant C Data is divided into 100 sec bins |
 |
 |
| Module-wise count rates for Quadrant D Data is divided into 100 sec bins |
 |
 |
| Parameter | Plot |
|---|---|
| CZT HV Monitor |  |
| D_VDD |  |
| Temperature 1 |  |
| Veto HV Monitor |  |
| Veto LLD | 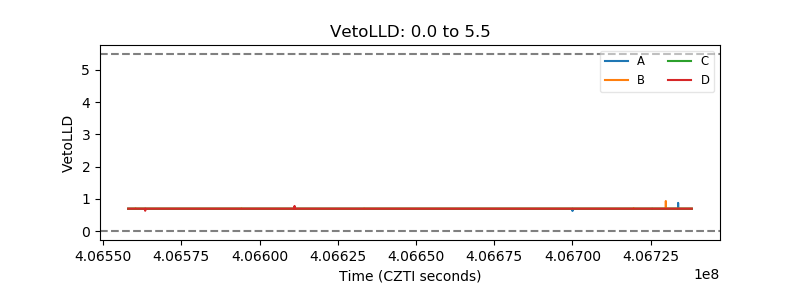 |
| Alpha Counter | 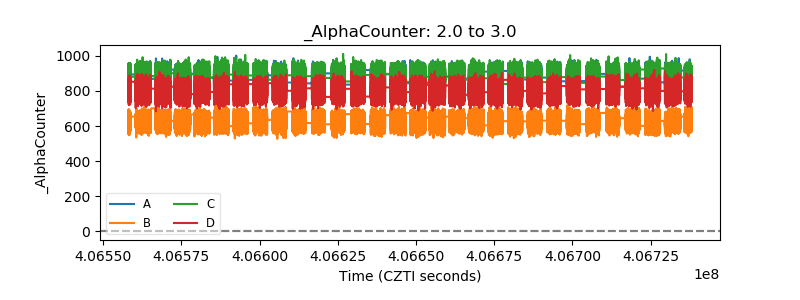 |
| _CPM_Rate |  |
| CZT Counter | 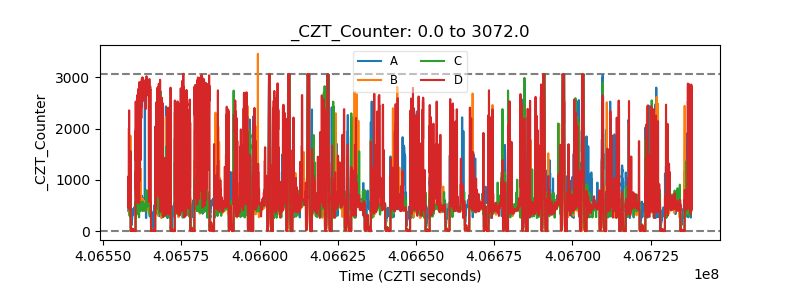 |
| +2.5 Volts monitor |  |
| +5 Volts monitor | 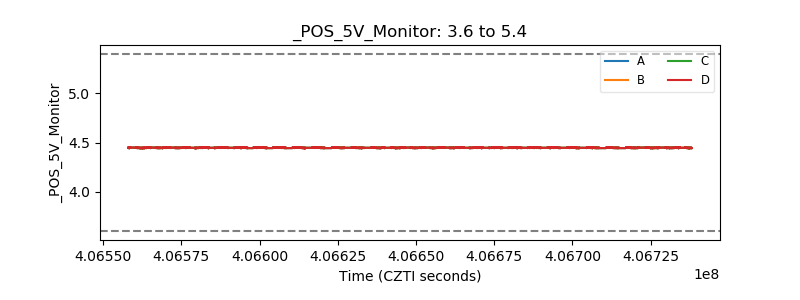 |
| _ROLL_ROT |  |
| _Roll_DEC |  |
| _Roll_RA |  |
| Veto Counter | 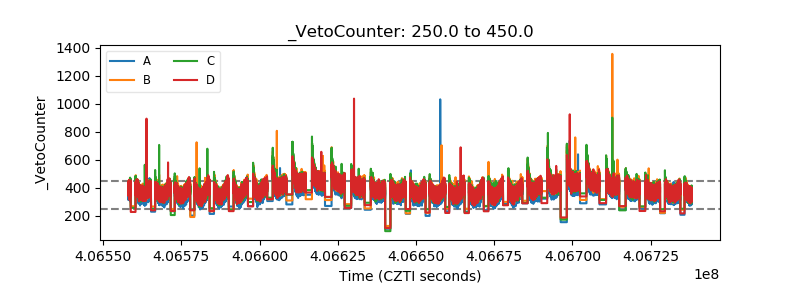 |