| Param | Original file | Final file |
|---|---|---|
| Filename | modeM0/AS1A12_025T10_9000005384cztM0_level2.fits | modeM0/AS1A12_025T10_9000005384cztM0_level2_quad_clean.evt |
| Size (bytes) | 238,734,720 | 239,114,880 |
| Size | 227.7 MB | 228.0 MB |
| Events in quadrant A | 1,438,886 | 1,450,284 |
| Events in quadrant B | 1,335,794 | 1,350,047 |
| Events in quadrant C | 1,423,116 | 1,414,207 |
| Events in quadrant D | 1,171,230 | 1,166,508 |
| Mode SS | |||
|---|---|---|---|
| Quadrant | BADHDUFLAG | Total packets | Discarded packets |
| A | 0 | 552 | 0 |
| B | 0 | 552 | 0 |
| C | 0 | 552 | 0 |
| D | 0 | 552 | 0 |
| Mode M0 | |||
|---|---|---|---|
| Quadrant | BADHDUFLAG | Total packets | Discarded packets |
| A | 0 | 61028 | 0 |
| B | 0 | 70146 | 0 |
| C | 0 | 54799 | 0 |
| D | 0 | 115176 | 0 |
| Mode M9 | |||
|---|---|---|---|
| Quadrant | BADHDUFLAG | Total packets | Discarded packets |
| A | 0 | 69 | 0 |
| B | 0 | 69 | 0 |
| C | 0 | 69 | 0 |
| D | 0 | 69 | 0 |
| Quadrant | Total seconds | Saturated seconds | Saturation percentage |
|---|---|---|---|
| A | 27041 | 183 | 0.676750% |
| B | 27041 | 1750 | 6.471654% |
| C | 27041 | 21 | 0.077660% |
| D | 27041 | 1882 | 6.959802% |
Noise dominated data is calculated using 1-second bins in cleaned event files. If a bin has >2000 counts, and if more than 50% of those come from <1% of pixels, then it is considered to be noise-dominated and hence unusable.
| Quadrant | # 1 sec bins | Bins with >0 counts | Bins with >2000 counts | High rate bins dominated by noise | Noise dominated (total time) | Noise dominated (detector-on time) | Marked lightcurve |
|---|---|---|---|---|---|---|---|
| A | 33996 | 27039 | 0 | 0 | 0.00% | 0.00% |  |
| B | 33996 | 26964 | 0 | 0 | 0.00% | 0.00% |  |
| C | 33996 | 27041 | 0 | 0 | 0.00% | 0.00% |  |
| D | 33996 | 27038 | 0 | 0 | 0.00% | 0.00% |  |
Top three noisy pixels from each quadrant. If the there are fewer than three noisy pixels in the level2.evt file, extra rows are filled as -1
| Pixel properties | Quadrant properties | ||||||
|---|---|---|---|---|---|---|---|
| Quadrant | DetID | PixID | Counts | Sigma | Mean | Median | Sigma |
| A | 9 | 19 | 1214 | 8.96 | 375 | 352 | 96.2 |
| A | 7 | 110 | 1213 | 8.95 | 375 | 352 | 96.2 |
| A | 0 | 29 | 1148 | 8.27 | 375 | 352 | 96.2 |
| B | 2 | 9 | 1170 | 11.81 | 353 | 336 | 70.6 |
| B | 3 | 80 | 1089 | 10.67 | 353 | 336 | 70.6 |
| B | 5 | 255 | 942 | 8.58 | 353 | 336 | 70.6 |
| C | 1 | 81 | 1217 | 8.87 | 376 | 351 | 97.6 |
| C | 1 | 80 | 1172 | 8.41 | 376 | 351 | 97.6 |
| C | 3 | 158 | 992 | 6.57 | 376 | 351 | 97.6 |
| D | 4 | 160 | 886 | 6.49 | 334 | 303 | 89.8 |
| D | 1 | 3 | 878 | 6.4 | 334 | 303 | 89.8 |
| D | 7 | 3 | 865 | 6.26 | 334 | 303 | 89.8 |
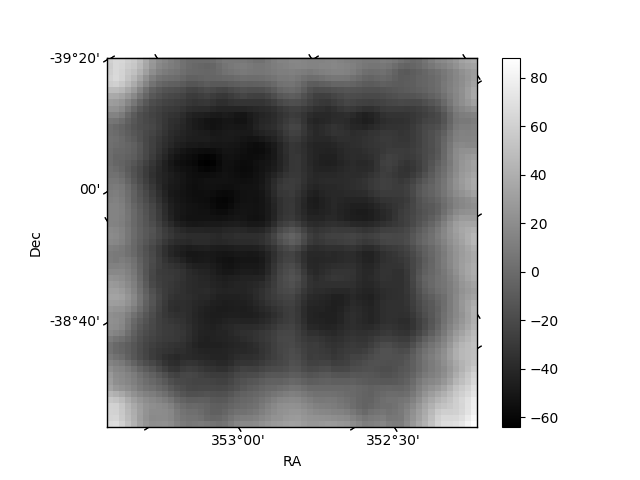
Histogram calculated using DETX and DETY for each event in the final _common_clean file
| Quadrant A |  |
 |
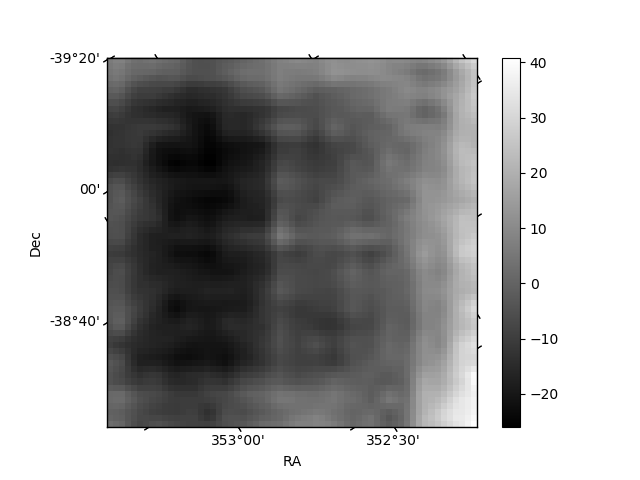
Quadrant B |
|---|---|---|---|
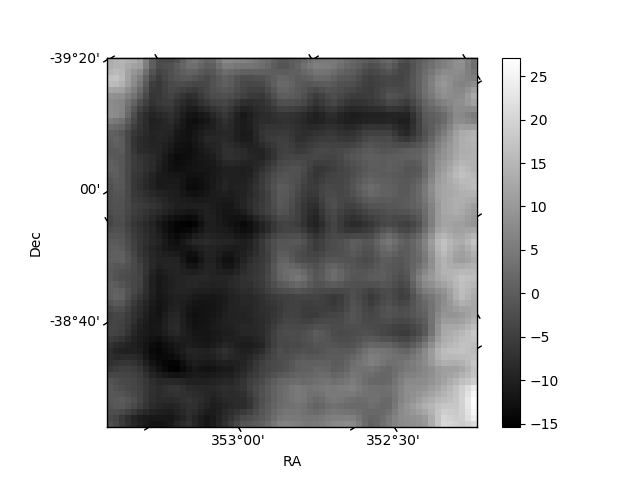
| Quadrant D |  |
 |
Quadrant C |
| Plot type | Count rate plots | Images |
|---|---|---|
| Comparison with Poisson distribution Blue bars denote a histogram of data divided into 1 sec bins. Red curve is a Poisson curve with rate = median count rate of data. |
 |
 |
| Quadrant-wise count rates Data is divided into 100 sec bins |
 |
|
| Module-wise count rates for Quadrant A Data is divided into 100 sec bins |
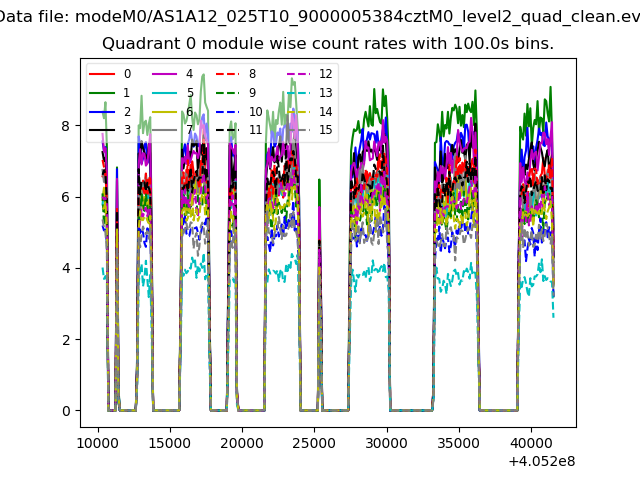 |
 |
| Module-wise count rates for Quadrant B Data is divided into 100 sec bins |
 |
 |
| Module-wise count rates for Quadrant C Data is divided into 100 sec bins |
 |
 |
| Module-wise count rates for Quadrant D Data is divided into 100 sec bins |
 |
 |
| Parameter | Plot |
|---|---|
| CZT HV Monitor |  |
| D_VDD |  |
| Temperature 1 |  |
| Veto HV Monitor | 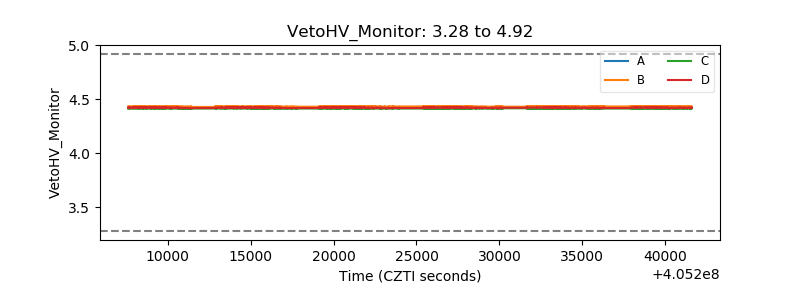 |
| Veto LLD |  |
| Alpha Counter | 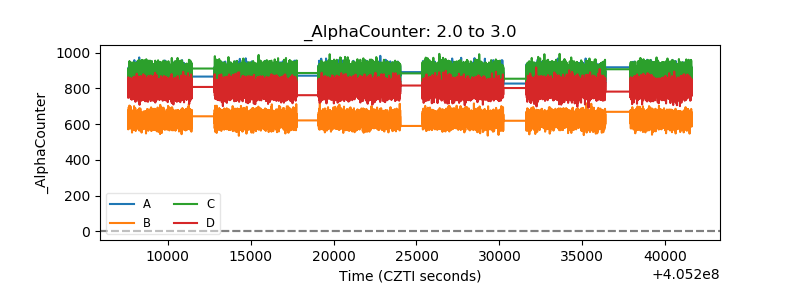 |
| _CPM_Rate |  |
| CZT Counter |  |
| +2.5 Volts monitor |  |
| +5 Volts monitor |  |
| _ROLL_ROT |  |
| _Roll_DEC |  |
| _Roll_RA |  |
| Veto Counter |  |