| Param | Original file | Final file |
|---|---|---|
| Filename | modeM0/AS1A07_093T02_9000005368cztM0_level2.fits | modeM0/AS1A07_093T02_9000005368cztM0_level2_quad_clean.evt |
| Size (bytes) | 167,328,000 | 171,293,760 |
| Size | 159.6 MB | 163.4 MB |
| Events in quadrant A | 999,236 | 1,017,291 |
| Events in quadrant B | 932,482 | 1,016,906 |
| Events in quadrant C | 994,290 | 980,858 |
| Events in quadrant D | 846,878 | 877,561 |
| Mode SS | |||
|---|---|---|---|
| Quadrant | BADHDUFLAG | Total packets | Discarded packets |
| A | 0 | 384 | 0 |
| B | 0 | 384 | 0 |
| C | 0 | 384 | 0 |
| D | 0 | 384 | 0 |
| Mode M9 | |||
|---|---|---|---|
| Quadrant | BADHDUFLAG | Total packets | Discarded packets |
| A | 0 | 62 | 0 |
| B | 0 | 62 | 0 |
| C | 0 | 62 | 0 |
| D | 0 | 62 | 0 |
| Mode M0 | |||
|---|---|---|---|
| Quadrant | BADHDUFLAG | Total packets | Discarded packets |
| A | 0 | 39763 | 0 |
| B | 0 | 44581 | 0 |
| C | 0 | 38098 | 0 |
| D | 0 | 53424 | 0 |
| Quadrant | Total seconds | Saturated seconds | Saturation percentage |
|---|---|---|---|
| A | 18786 | 21 | 0.111785% |
| B | 18786 | 852 | 4.535292% |
| C | 18786 | 13 | 0.069200% |
| D | 18786 | 492 | 2.618972% |
Noise dominated data is calculated using 1-second bins in cleaned event files. If a bin has >2000 counts, and if more than 50% of those come from <1% of pixels, then it is considered to be noise-dominated and hence unusable.
| Quadrant | # 1 sec bins | Bins with >0 counts | Bins with >2000 counts | High rate bins dominated by noise | Noise dominated (total time) | Noise dominated (detector-on time) | Marked lightcurve |
|---|---|---|---|---|---|---|---|
| A | 24967 | 18786 | 0 | 0 | 0.00% | 0.00% | 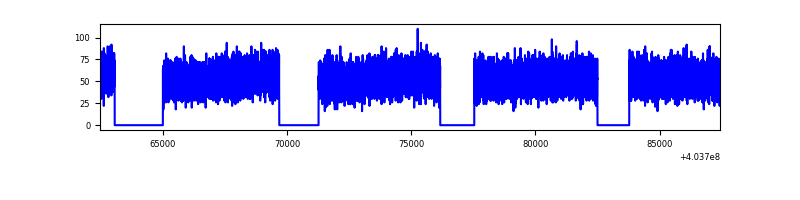 |
| B | 24967 | 18732 | 0 | 0 | 0.00% | 0.00% | 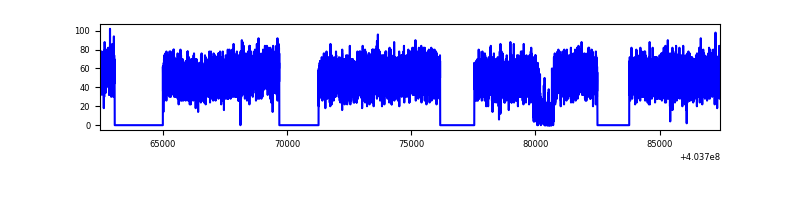 |
| C | 24967 | 18786 | 0 | 0 | 0.00% | 0.00% |  |
| D | 24967 | 18775 | 0 | 0 | 0.00% | 0.00% |  |
Top three noisy pixels from each quadrant. If the there are fewer than three noisy pixels in the level2.evt file, extra rows are filled as -1
| Pixel properties | Quadrant properties | ||||||
|---|---|---|---|---|---|---|---|
| Quadrant | DetID | PixID | Counts | Sigma | Mean | Median | Sigma |
| A | 0 | 29 | 868 | 9.39 | 260 | 245 | 66.4 |
| A | 7 | 110 | 857 | 9.22 | 260 | 245 | 66.4 |
| A | 14 | 95 | 808 | 8.48 | 260 | 245 | 66.4 |
| B | 2 | 9 | 816 | 11.28 | 247 | 236 | 51.4 |
| B | 3 | 80 | 697 | 8.96 | 247 | 236 | 51.4 |
| B | 5 | 128 | 667 | 8.38 | 247 | 236 | 51.4 |
| C | 1 | 81 | 817 | 8.38 | 263 | 246 | 68.1 |
| C | 1 | 80 | 795 | 8.06 | 263 | 246 | 68.1 |
| C | 3 | 187 | 692 | 6.55 | 263 | 246 | 68.1 |
| D | 10 | 113 | 651 | 6.49 | 242 | 220 | 66.4 |
| D | 10 | 189 | 636 | 6.27 | 242 | 220 | 66.4 |
| D | 6 | 67 | 625 | 6.1 | 242 | 220 | 66.4 |
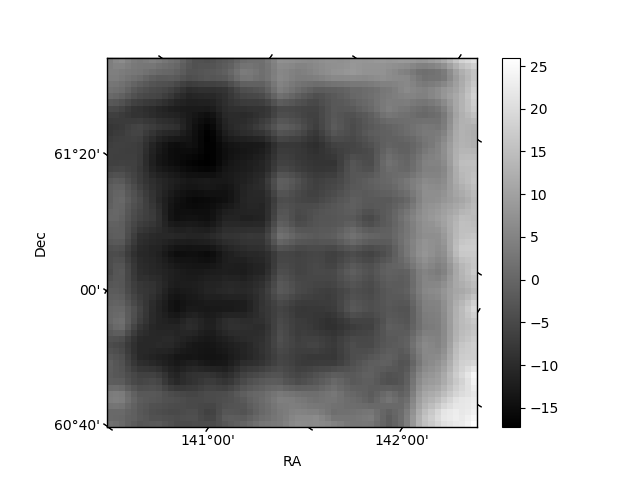
Histogram calculated using DETX and DETY for each event in the final _common_clean file
| Quadrant A |  |
 |
Quadrant B |
|---|---|---|---|
| Quadrant D | 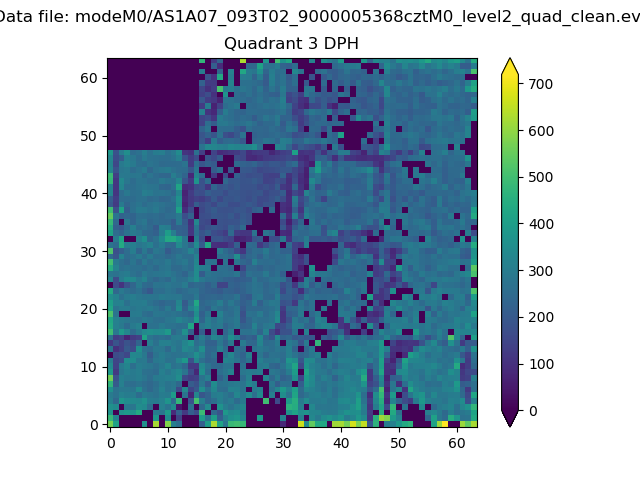 |
 |
Quadrant C |
| Plot type | Count rate plots | Images |
|---|---|---|
| Comparison with Poisson distribution Blue bars denote a histogram of data divided into 1 sec bins. Red curve is a Poisson curve with rate = median count rate of data. |
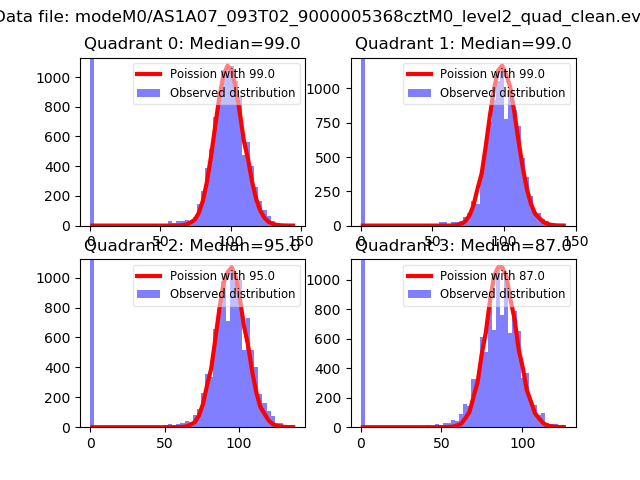 |
 |
| Quadrant-wise count rates Data is divided into 100 sec bins |
 |
|
| Module-wise count rates for Quadrant A Data is divided into 100 sec bins |
 |
 |
| Module-wise count rates for Quadrant B Data is divided into 100 sec bins |
 |
 |
| Module-wise count rates for Quadrant C Data is divided into 100 sec bins |
 |
 |
| Module-wise count rates for Quadrant D Data is divided into 100 sec bins |
 |
 |
| Parameter | Plot |
|---|---|
| CZT HV Monitor | 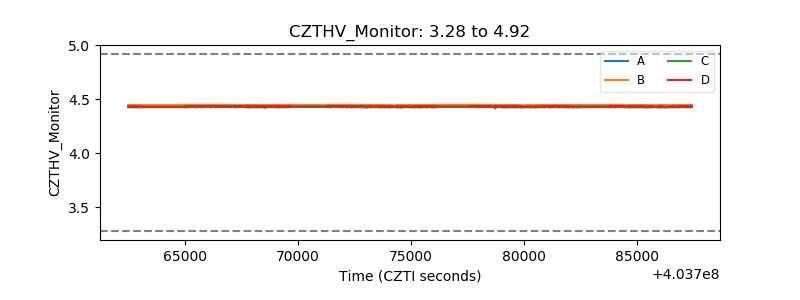 |
| D_VDD | 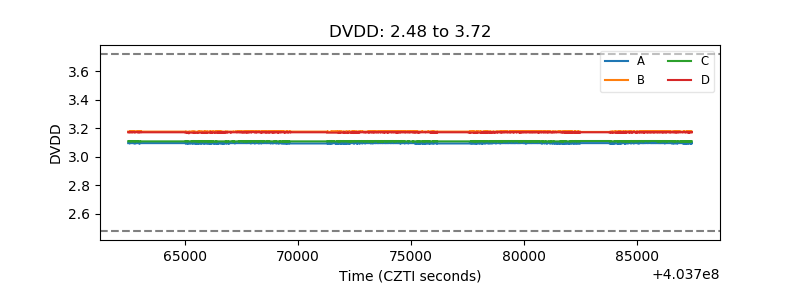 |
| Temperature 1 |  |
| Veto HV Monitor |  |
| Veto LLD |  |
| Alpha Counter |  |
| _CPM_Rate |  |
| CZT Counter |  |
| +2.5 Volts monitor |  |
| +5 Volts monitor |  |
| _ROLL_ROT |  |
| _Roll_DEC |  |
| _Roll_RA |  |
| Veto Counter |  |