| Param | Original file | Final file |
|---|---|---|
| Filename | modeM0/AS1C07_001T12_9000005366cztM0_level2.fits | modeM0/AS1C07_001T12_9000005366cztM0_level2_quad_clean.evt |
| Size (bytes) | 790,280,640 | 1,190,430,720 |
| Size | 753.7 MB | 1.1 GB |
| Events in quadrant A | 4,748,210 | 7,877,222 |
| Events in quadrant B | 4,598,414 | 7,890,521 |
| Events in quadrant C | 4,692,194 | 7,570,646 |
| Events in quadrant D | 4,021,514 | 6,847,029 |
| Mode M0 | |||
|---|---|---|---|
| Quadrant | BADHDUFLAG | Total packets | Discarded packets |
| A | 0 | 191896 | 0 |
| B | 0 | 184075 | 0 |
| C | 0 | 178587 | 0 |
| D | 0 | 202896 | 0 |
| Mode M9 | |||
|---|---|---|---|
| Quadrant | BADHDUFLAG | Total packets | Discarded packets |
| A | 0 | 345 | 0 |
| B | 0 | 345 | 0 |
| C | 0 | 345 | 0 |
| D | 0 | 345 | 0 |
| Mode SS | |||
|---|---|---|---|
| Quadrant | BADHDUFLAG | Total packets | Discarded packets |
| A | 0 | 1752 | 0 |
| B | 0 | 1752 | 0 |
| C | 0 | 1752 | 0 |
| D | 0 | 1752 | 0 |
| Quadrant | Total seconds | Saturated seconds | Saturation percentage |
|---|---|---|---|
| A | 85680 | 310 | 0.361811% |
| B | 85675 | 774 | 0.903414% |
| C | 85680 | 199 | 0.232260% |
| D | 85681 | 1515 | 1.768187% |
Noise dominated data is calculated using 1-second bins in cleaned event files. If a bin has >2000 counts, and if more than 50% of those come from <1% of pixels, then it is considered to be noise-dominated and hence unusable.
| Quadrant | # 1 sec bins | Bins with >0 counts | Bins with >2000 counts | High rate bins dominated by noise | Noise dominated (total time) | Noise dominated (detector-on time) | Marked lightcurve |
|---|---|---|---|---|---|---|---|
| A | 125624 | 85682 | 0 | 0 | 0.00% | 0.00% |  |
| B | 125624 | 85674 | 0 | 0 | 0.00% | 0.00% |  |
| C | 125624 | 85678 | 0 | 0 | 0.00% | 0.00% |  |
| D | 125624 | 85630 | 0 | 0 | 0.00% | 0.00% |  |
Top three noisy pixels from each quadrant. If the there are fewer than three noisy pixels in the level2.evt file, extra rows are filled as -1
| Pixel properties | Quadrant properties | ||||||
|---|---|---|---|---|---|---|---|
| Quadrant | DetID | PixID | Counts | Sigma | Mean | Median | Sigma |
| A | 7 | 110 | 3997 | 9.15 | 1242 | 1173 | 308.4 |
| A | 9 | 19 | 3931 | 8.94 | 1242 | 1173 | 308.4 |
| A | 0 | 29 | 3836 | 8.63 | 1242 | 1173 | 308.4 |
| B | 2 | 9 | 3902 | 11.58 | 1219 | 1167 | 236.2 |
| B | 3 | 80 | 3569 | 10.17 | 1219 | 1167 | 236.2 |
| B | 5 | 255 | 3304 | 9.04 | 1219 | 1167 | 236.2 |
| C | 1 | 81 | 3994 | 8.91 | 1242 | 1173 | 316.6 |
| C | 1 | 80 | 3893 | 8.59 | 1242 | 1173 | 316.6 |
| C | 3 | 202 | 3729 | 8.07 | 1242 | 1173 | 316.6 |
| D | 7 | 3 | 3007 | 6.26 | 1155 | 1056 | 311.9 |
| D | 6 | 62 | 2926 | 6.0 | 1155 | 1056 | 311.9 |
| D | 10 | 113 | 2925 | 5.99 | 1155 | 1056 | 311.9 |
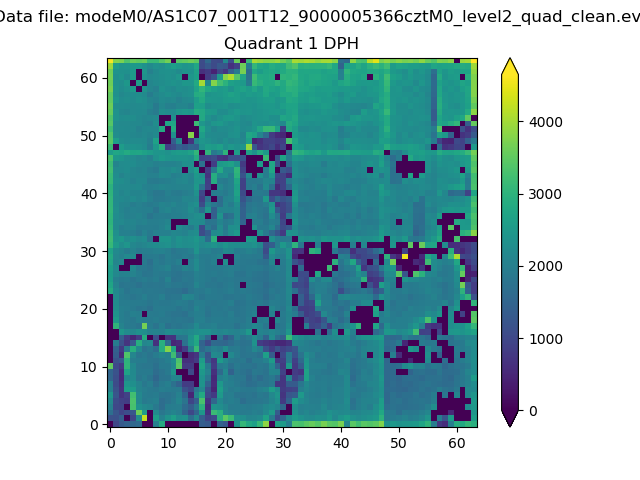
Histogram calculated using DETX and DETY for each event in the final _common_clean file
| Quadrant A |  |
 |
Quadrant B |
|---|---|---|---|
| Quadrant D |  |
 |
Quadrant C |
| Plot type | Count rate plots | Images |
|---|---|---|
| Comparison with Poisson distribution Blue bars denote a histogram of data divided into 1 sec bins. Red curve is a Poisson curve with rate = median count rate of data. |
 |
 |
| Quadrant-wise count rates Data is divided into 100 sec bins |
 |
|
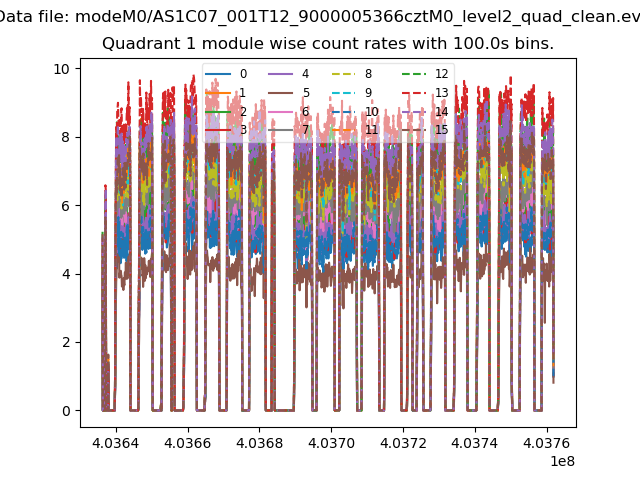
| Module-wise count rates for Quadrant A Data is divided into 100 sec bins |
 |
 |
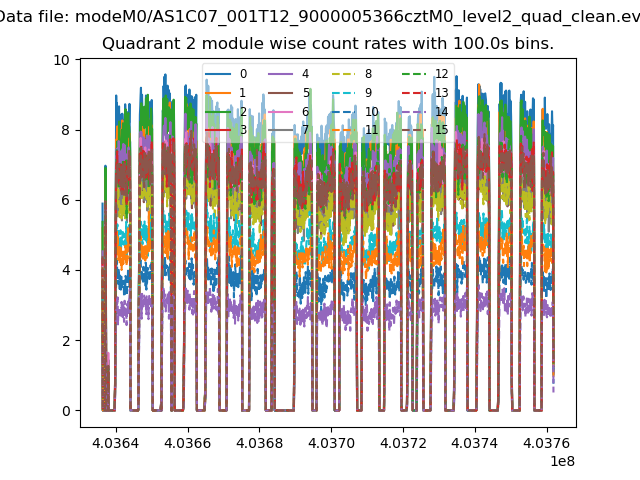
| Module-wise count rates for Quadrant B Data is divided into 100 sec bins |
 |
 |
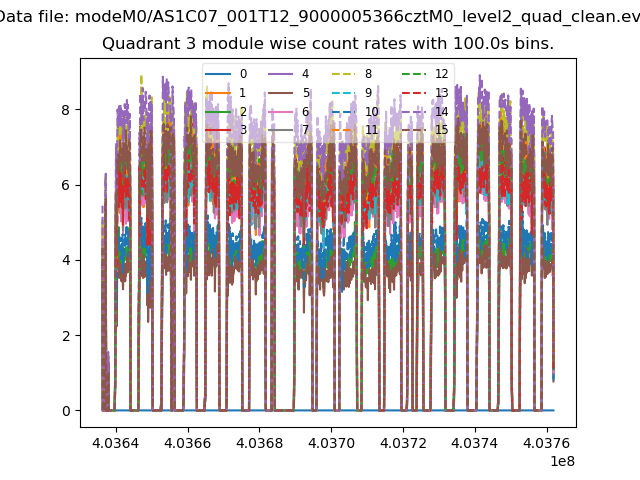
| Module-wise count rates for Quadrant C Data is divided into 100 sec bins |
 |
 |
| Module-wise count rates for Quadrant D Data is divided into 100 sec bins |
 |
 |
| Parameter | Plot |
|---|---|
| CZT HV Monitor |  |
| D_VDD |  |
| Temperature 1 |  |
| Veto HV Monitor |  |
| Veto LLD |  |
| Alpha Counter |  |
| _CPM_Rate |  |
| CZT Counter |  |
| +2.5 Volts monitor | 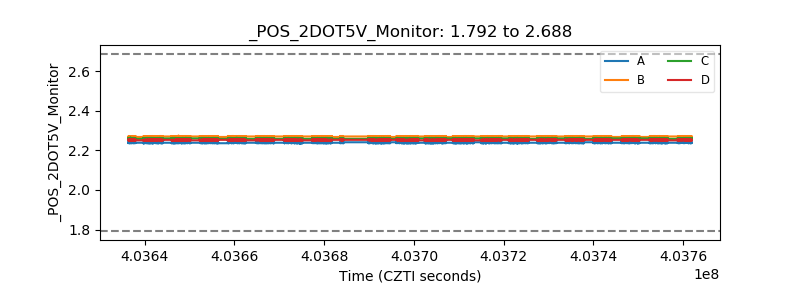 |
| +5 Volts monitor |  |
| _ROLL_ROT | 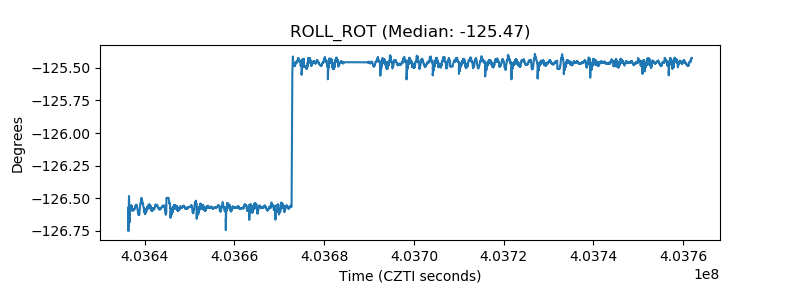 |
| _Roll_DEC | 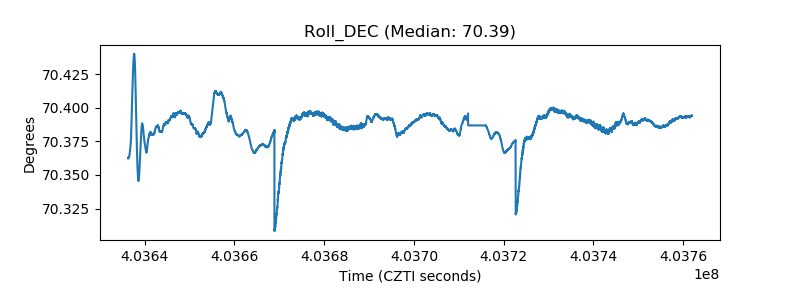 |
| _Roll_RA |  |
| Veto Counter |  |