| Param | Original file | Final file |
|---|---|---|
| Filename | modeM0/AS1A11_047T09_9000005362cztM0_level2.fits | modeM0/AS1A11_047T09_9000005362cztM0_level2_quad_clean.evt |
| Size (bytes) | 1,507,800,960 | 1,605,297,600 |
| Size | 1.4 GB | 1.5 GB |
| Events in quadrant A | 9,259,414 | 10,020,744 |
| Events in quadrant B | 8,855,158 | 9,977,654 |
| Events in quadrant C | 8,933,142 | 9,250,742 |
| Events in quadrant D | 7,542,130 | 8,304,599 |
| Mode M0 | |||
|---|---|---|---|
| Quadrant | BADHDUFLAG | Total packets | Discarded packets |
| A | 0 | 359732 | 0 |
| B | 0 | 360693 | 0 |
| C | 0 | 404185 | 0 |
| D | 0 | 521154 | 0 |
| Mode SS | |||
|---|---|---|---|
| Quadrant | BADHDUFLAG | Total packets | Discarded packets |
| A | 0 | 3306 | 0 |
| B | 0 | 3306 | 0 |
| C | 0 | 3306 | 0 |
| D | 0 | 3306 | 0 |
| Mode M9 | |||
|---|---|---|---|
| Quadrant | BADHDUFLAG | Total packets | Discarded packets |
| A | 0 | 618 | 0 |
| B | 0 | 618 | 0 |
| C | 0 | 618 | 0 |
| D | 0 | 620 | 0 |
| Quadrant | Total seconds | Saturated seconds | Saturation percentage |
|---|---|---|---|
| A | 161495 | 706 | 0.437165% |
| B | 161521 | 2637 | 1.632605% |
| C | 161509 | 5622 | 3.480921% |
| D | 161487 | 15528 | 9.615635% |
Noise dominated data is calculated using 1-second bins in cleaned event files. If a bin has >2000 counts, and if more than 50% of those come from <1% of pixels, then it is considered to be noise-dominated and hence unusable.
| Quadrant | # 1 sec bins | Bins with >0 counts | Bins with >2000 counts | High rate bins dominated by noise | Noise dominated (total time) | Noise dominated (detector-on time) | Marked lightcurve |
|---|---|---|---|---|---|---|---|
| A | 262862 | 161515 | 0 | 0 | 0.00% | 0.00% | 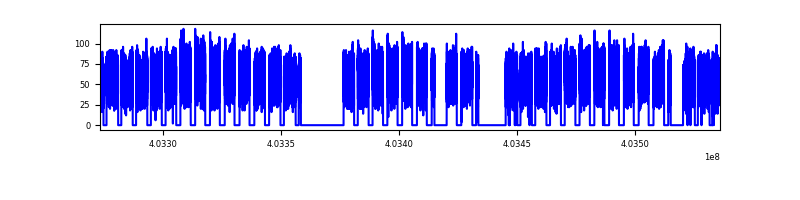 |
| B | 262862 | 161494 | 0 | 0 | 0.00% | 0.00% |  |
| C | 262862 | 161352 | 0 | 0 | 0.00% | 0.00% |  |
| D | 262862 | 161331 | 0 | 0 | 0.00% | 0.00% |  |
Top three noisy pixels from each quadrant. If the there are fewer than three noisy pixels in the level2.evt file, extra rows are filled as -1
| Pixel properties | Quadrant properties | ||||||
|---|---|---|---|---|---|---|---|
| Quadrant | DetID | PixID | Counts | Sigma | Mean | Median | Sigma |
| A | 0 | 29 | 7517 | 8.75 | 2421 | 2270 | 599.4 |
| A | 9 | 19 | 7482 | 8.69 | 2421 | 2270 | 599.4 |
| A | 7 | 110 | 7389 | 8.54 | 2421 | 2270 | 599.4 |
| B | 2 | 9 | 7589 | 11.73 | 2348 | 2238 | 456.1 |
| B | 3 | 80 | 6911 | 10.25 | 2348 | 2238 | 456.1 |
| B | 5 | 128 | 6121 | 8.51 | 2348 | 2238 | 456.1 |
| C | 1 | 81 | 7335 | 8.51 | 2364 | 2208 | 602.2 |
| C | 1 | 80 | 7060 | 8.06 | 2364 | 2208 | 602.2 |
| C | 3 | 202 | 6812 | 7.65 | 2364 | 2208 | 602.2 |
| D | 7 | 3 | 5586 | 6.27 | 2159 | 1964 | 577.9 |
| D | 10 | 189 | 5453 | 6.04 | 2159 | 1964 | 577.9 |
| D | 6 | 231 | 5440 | 6.01 | 2159 | 1964 | 577.9 |
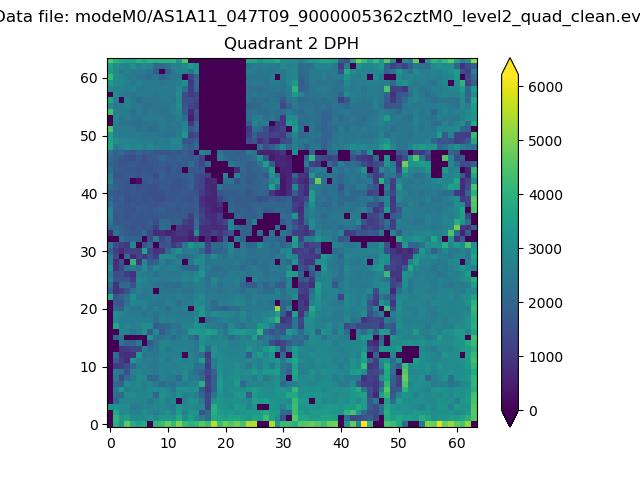
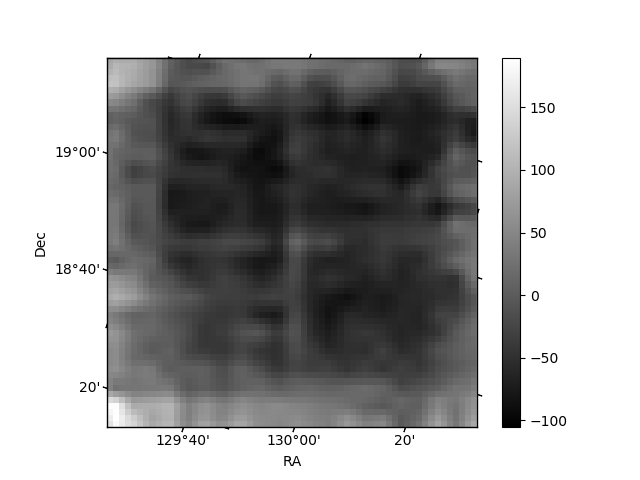
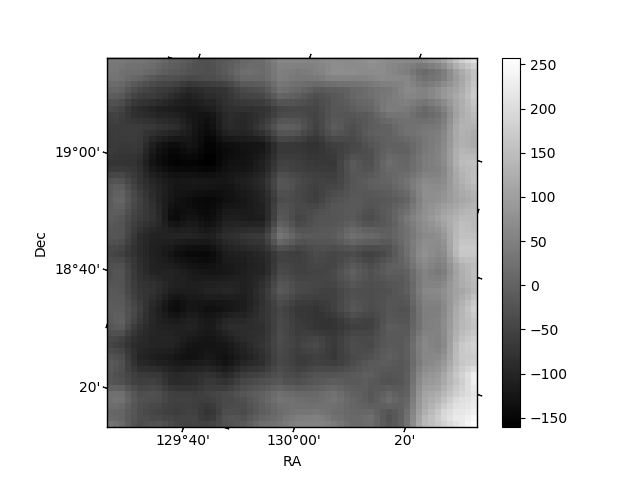
Histogram calculated using DETX and DETY for each event in the final _common_clean file
| Quadrant A |  |
 |
Quadrant B |
|---|---|---|---|
| Quadrant D | 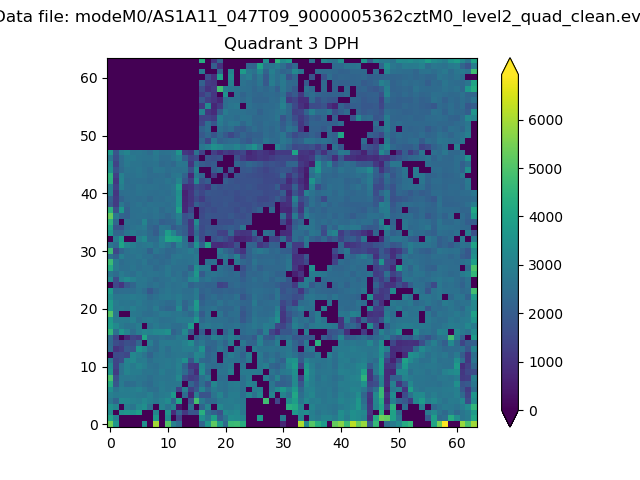 |
 |
Quadrant C |
| Plot type | Count rate plots | Images |
|---|---|---|
| Comparison with Poisson distribution Blue bars denote a histogram of data divided into 1 sec bins. Red curve is a Poisson curve with rate = median count rate of data. |
 |
 |
| Quadrant-wise count rates Data is divided into 100 sec bins |
 |
|
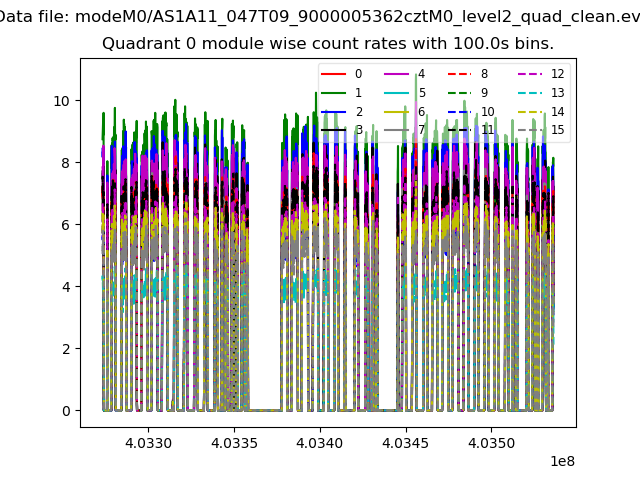
| Module-wise count rates for Quadrant A Data is divided into 100 sec bins |
 |
 |
| Module-wise count rates for Quadrant B Data is divided into 100 sec bins |
 |
 |
| Module-wise count rates for Quadrant C Data is divided into 100 sec bins |
 |
 |
| Module-wise count rates for Quadrant D Data is divided into 100 sec bins |
 |
 |
| Parameter | Plot |
|---|---|
| CZT HV Monitor | 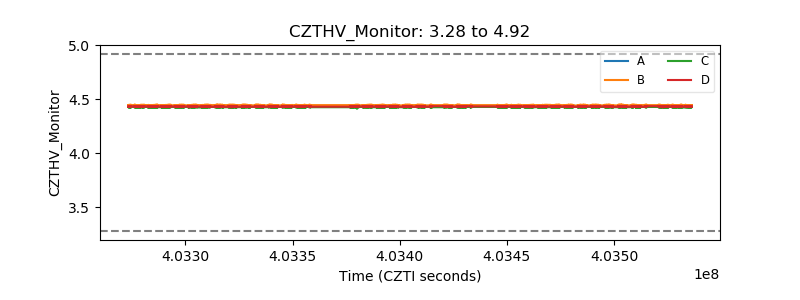 |
| D_VDD |  |
| Temperature 1 | 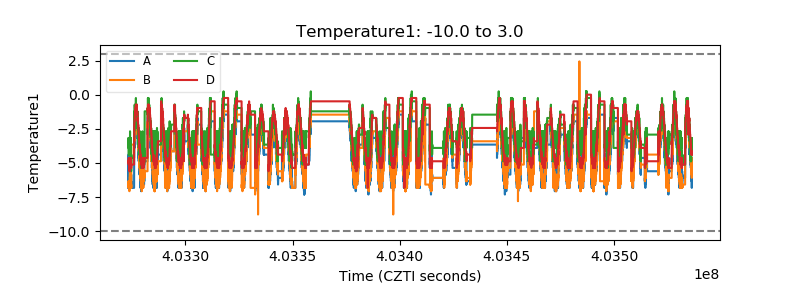 |
| Veto HV Monitor | 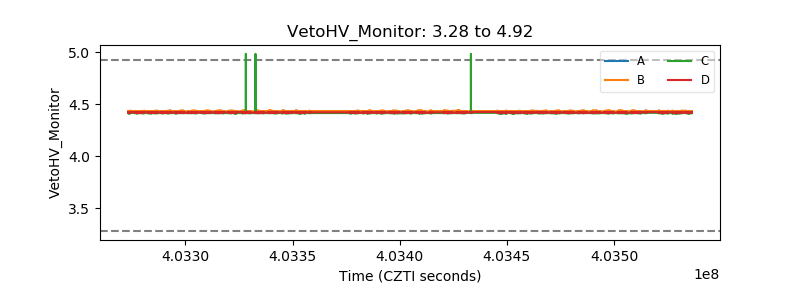 |
| Veto LLD |  |
| Alpha Counter |  |
| _CPM_Rate |  |
| CZT Counter |  |
| +2.5 Volts monitor |  |
| +5 Volts monitor | 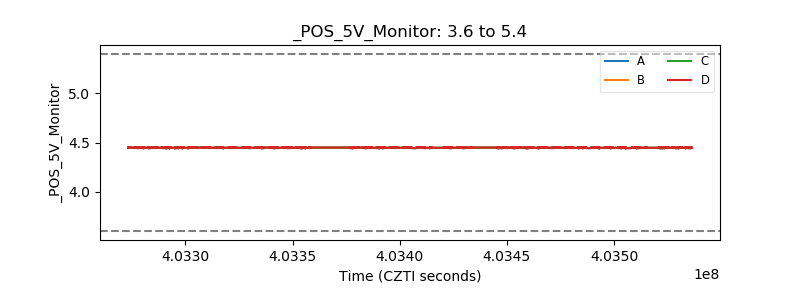 |
| _ROLL_ROT |  |
| _Roll_DEC |  |
| _Roll_RA |  |
| Veto Counter |  |