| Param | Original file | Final file |
|---|---|---|
| Filename | modeM0/AS1A10_103T06_9000005348cztM0_level2_bc.evt | modeM0/AS1A10_103T06_9000005348cztM0_level2_quad_clean.evt |
| Size (bytes) | 3,062,548,800 | 913,199,040 |
| Size | 2.9 GB | 870.9 MB |
| Events in quadrant A | 19,341,674 | 5,876,169 |
| Events in quadrant B | 22,692,190 | 5,831,392 |
| Events in quadrant C | 17,834,800 | 5,934,588 |
| Events in quadrant D | 28,273,887 | 5,372,411 |
| Mode M9 | |||
|---|---|---|---|
| Quadrant | BADHDUFLAG | Total packets | Discarded packets |
| A | 0 | 264 | 0 |
| B | 0 | 264 | 0 |
| C | 0 | 264 | 0 |
| D | 0 | 264 | 0 |
| Mode M0 | |||
|---|---|---|---|
| Quadrant | BADHDUFLAG | Total packets | Discarded packets |
| A | 0 | 149850 | 0 |
| B | 0 | 170155 | 0 |
| C | 0 | 142994 | 0 |
| D | 0 | 192055 | 0 |
| Mode SS | |||
|---|---|---|---|
| Quadrant | BADHDUFLAG | Total packets | Discarded packets |
| A | 0 | 1386 | 0 |
| B | 0 | 1386 | 0 |
| C | 0 | 1386 | 0 |
| D | 0 | 1386 | 0 |
| Quadrant | Total seconds | Saturated seconds | Saturation percentage |
|---|---|---|---|
| A | 67722 | 263 | 0.388352% |
| B | 67722 | 2115 | 3.123062% |
| C | 67722 | 225 | 0.332241% |
| D | 67723 | 4663 | 6.885401% |
Noise dominated data is calculated using 1-second bins in cleaned event files. If a bin has >2000 counts, and if more than 50% of those come from <1% of pixels, then it is considered to be noise-dominated and hence unusable.
| Quadrant | # 1 sec bins | Bins with >0 counts | Bins with >2000 counts | High rate bins dominated by noise | Noise dominated (total time) | Noise dominated (detector-on time) | Marked lightcurve |
|---|---|---|---|---|---|---|---|
| A | 95317 | 67736 | 19 | 19 | 0.02% | 0.03% |  |
| B | 95317 | 67722 | 159 | 159 | 0.17% | 0.23% |  |
| C | 95317 | 67722 | 48 | 48 | 0.05% | 0.07% | 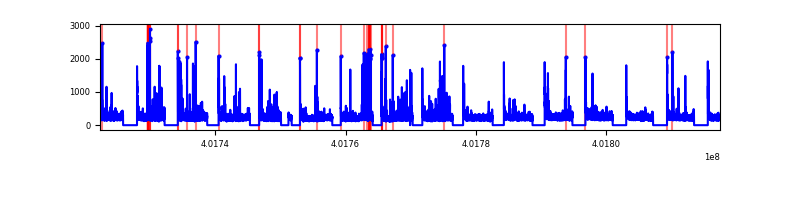 |
| D | 95317 | 67712 | 1130 | 1130 | 1.19% | 1.67% |  |
Top three noisy pixels from each quadrant. If the there are fewer than three noisy pixels in the level2.evt file, extra rows are filled as -1
| Pixel properties | Quadrant properties | ||||||
|---|---|---|---|---|---|---|---|
| Quadrant | DetID | PixID | Counts | Sigma | Mean | Median | Sigma |
| A | 10 | 83 | 3435355 | 4410.39 | 3538 | 3491 | 778.1 |
| A | 15 | 222 | 1222847 | 1567.03 | 3538 | 3491 | 778.1 |
| A | 9 | 143 | 502182 | 640.88 | 3538 | 3491 | 778.1 |
| B | 5 | 172 | 3120133 | 4464.67 | 3521 | 3447 | 698.1 |
| B | 10 | 246 | 1827449 | 2612.89 | 3521 | 3447 | 698.1 |
| B | 0 | 229 | 1694933 | 2423.06 | 3521 | 3447 | 698.1 |
| C | 15 | 214 | 2888468 | 3684.46 | 3462 | 3447 | 783.0 |
| C | 0 | 10 | 611219 | 776.19 | 3462 | 3447 | 783.0 |
| C | 0 | 207 | 502580 | 637.44 | 3462 | 3447 | 783.0 |
| D | 13 | 249 | 5654031 | 7104.39 | 3392 | 3302 | 795.4 |
| D | 5 | 222 | 2253242 | 2828.74 | 3392 | 3302 | 795.4 |
| D | 2 | 249 | 1100907 | 1379.97 | 3392 | 3302 | 795.4 |
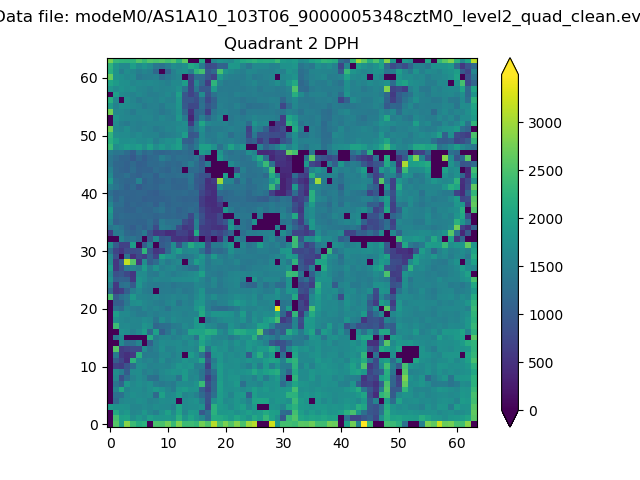
Histogram calculated using DETX and DETY for each event in the final _common_clean file
| Quadrant A |  |
 |
Quadrant B |
|---|---|---|---|
| Quadrant D |  |
 |
Quadrant C |
| Plot type | Count rate plots | Images |
|---|---|---|
| Comparison with Poisson distribution Blue bars denote a histogram of data divided into 1 sec bins. Red curve is a Poisson curve with rate = median count rate of data. |
 |
 |
| Quadrant-wise count rates Data is divided into 100 sec bins |
 |
|
| Module-wise count rates for Quadrant A Data is divided into 100 sec bins |
 |
 |
| Module-wise count rates for Quadrant B Data is divided into 100 sec bins |
 |
 |
| Module-wise count rates for Quadrant C Data is divided into 100 sec bins |
 |
 |
| Module-wise count rates for Quadrant D Data is divided into 100 sec bins |
 |
 |
| Parameter | Plot |
|---|---|
| CZT HV Monitor |  |
| D_VDD |  |
| Temperature 1 |  |
| Veto HV Monitor |  |
| Veto LLD |  |
| Alpha Counter |  |
| _CPM_Rate | 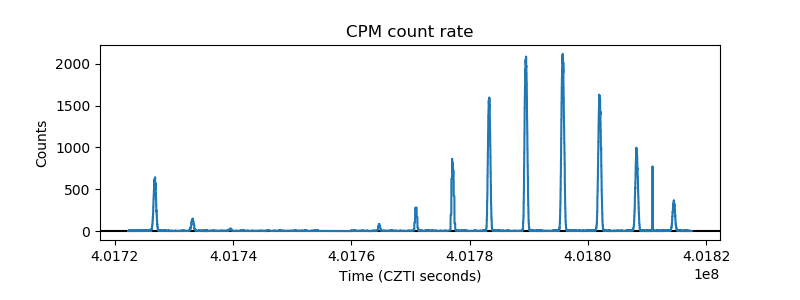 |
| CZT Counter |  |
| +2.5 Volts monitor |  |
| +5 Volts monitor | 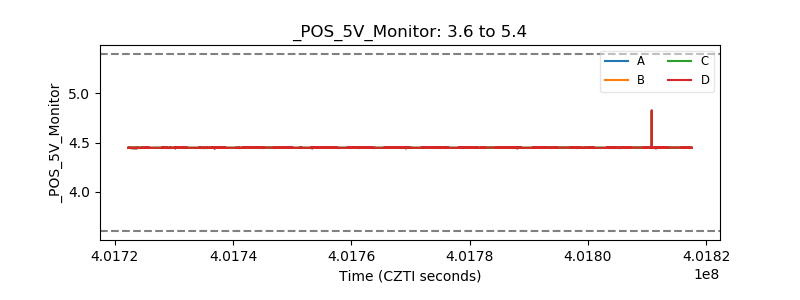 |
| _ROLL_ROT |  |
| _Roll_DEC |  |
| _Roll_RA |  |
| Veto Counter | 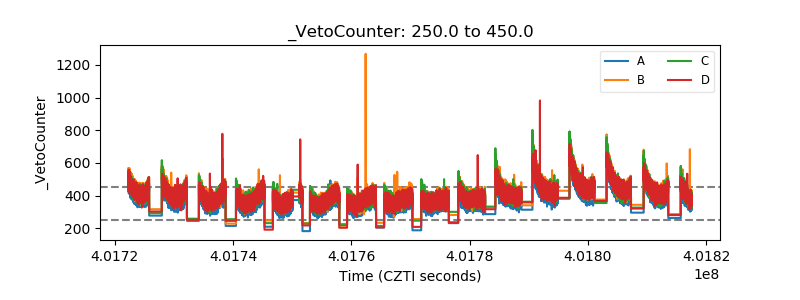 |