| Param | Original file | Final file |
|---|---|---|
| Filename | modeM0/AS1A11_106T02_9000005344cztM0_level2_bc.evt | modeM0/AS1A11_106T02_9000005344cztM0_level2_quad_clean.evt |
| Size (bytes) | 15,537,749,760 | 3,561,085,440 |
| Size | 14.5 GB | 3.3 GB |
| Events in quadrant A | 132,982,503 | 21,133,565 |
| Events in quadrant B | 78,327,975 | 22,898,477 |
| Events in quadrant C | 74,316,665 | 23,307,040 |
| Events in quadrant D | 165,985,600 | 21,399,467 |
| Mode M9 | |||
|---|---|---|---|
| Quadrant | BADHDUFLAG | Total packets | Discarded packets |
| A | 0 | 1028 | 0 |
| B | 0 | 1028 | 0 |
| C | 0 | 1028 | 0 |
| D | 0 | 1029 | 0 |
| Mode SS | |||
|---|---|---|---|
| Quadrant | BADHDUFLAG | Total packets | Discarded packets |
| A | 0 | 5698 | 0 |
| B | 0 | 5698 | 0 |
| C | 0 | 5698 | 0 |
| D | 0 | 5698 | 0 |
| Mode M0 | |||
|---|---|---|---|
| Quadrant | BADHDUFLAG | Total packets | Discarded packets |
| A | 0 | 916372 | 0 |
| B | 0 | 641073 | 0 |
| C | 0 | 592253 | 0 |
| D | 0 | 950890 | 0 |
| Quadrant | Total seconds | Saturated seconds | Saturation percentage |
|---|---|---|---|
| A | 279071 | 42416 | 15.199000% |
| B | 279071 | 5226 | 1.872642% |
| C | 279070 | 1676 | 0.600566% |
| D | 279072 | 32093 | 11.499900% |
Noise dominated data is calculated using 1-second bins in cleaned event files. If a bin has >2000 counts, and if more than 50% of those come from <1% of pixels, then it is considered to be noise-dominated and hence unusable.
| Quadrant | # 1 sec bins | Bins with >0 counts | Bins with >2000 counts | High rate bins dominated by noise | Noise dominated (total time) | Noise dominated (detector-on time) | Marked lightcurve |
|---|---|---|---|---|---|---|---|
| A | 391556 | 279005 | 1962 | 1962 | 0.50% | 0.70% | 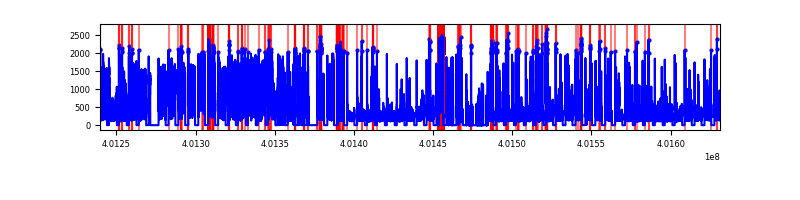 |
| B | 391556 | 279054 | 503 | 503 | 0.13% | 0.18% |  |
| C | 391556 | 279059 | 351 | 351 | 0.09% | 0.13% |  |
| D | 391556 | 279044 | 10152 | 10152 | 2.59% | 3.64% |  |
Top three noisy pixels from each quadrant. If the there are fewer than three noisy pixels in the level2.evt file, extra rows are filled as -1
| Pixel properties | Quadrant properties | ||||||
|---|---|---|---|---|---|---|---|
| Quadrant | DetID | PixID | Counts | Sigma | Mean | Median | Sigma |
| A | 15 | 222 | 62378638 | 21423.09 | 13149 | 12968 | 2911.1 |
| A | 10 | 83 | 13204317 | 4531.33 | 13149 | 12968 | 2911.1 |
| A | 9 | 143 | 2706917 | 925.39 | 13149 | 12968 | 2911.1 |
| B | 5 | 255 | 5434784 | 1947.27 | 14121 | 13827 | 2783.9 |
| B | 5 | 172 | 3733885 | 1336.29 | 14121 | 13827 | 2783.9 |
| B | 4 | 81 | 3059507 | 1094.04 | 14121 | 13827 | 2783.9 |
| C | 15 | 214 | 11366440 | 3519.27 | 13994 | 13920 | 3225.8 |
| C | 0 | 10 | 3482584 | 1075.28 | 13994 | 13920 | 3225.8 |
| C | 0 | 207 | 1599646 | 491.57 | 13994 | 13920 | 3225.8 |
| D | 12 | 227 | 32783893 | 10126.81 | 13451 | 13033 | 3236.0 |
| D | 2 | 249 | 20409393 | 6302.86 | 13451 | 13033 | 3236.0 |
| D | 12 | 235 | 19161138 | 5917.12 | 13451 | 13033 | 3236.0 |
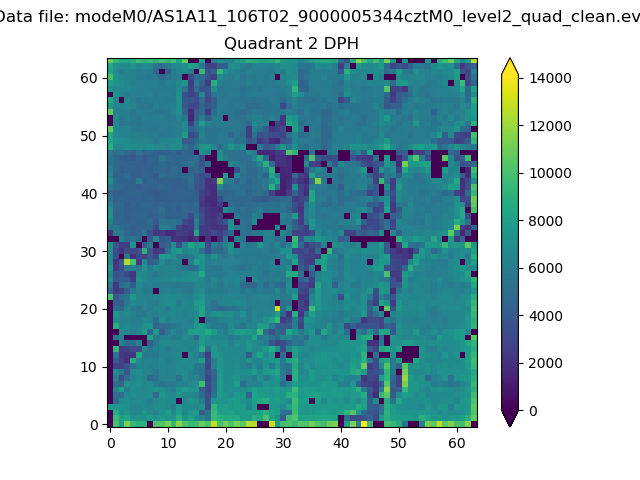
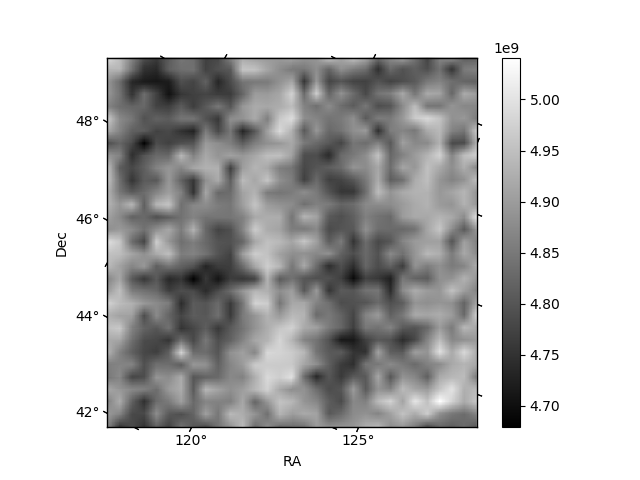
Histogram calculated using DETX and DETY for each event in the final _common_clean file
| Quadrant A |  |
 |
Quadrant B |
|---|---|---|---|
| Quadrant D |  |
 |
Quadrant C |
| Plot type | Count rate plots | Images |
|---|---|---|
| Comparison with Poisson distribution Blue bars denote a histogram of data divided into 1 sec bins. Red curve is a Poisson curve with rate = median count rate of data. |
 |
 |
| Quadrant-wise count rates Data is divided into 100 sec bins |
 |
|
| Module-wise count rates for Quadrant A Data is divided into 100 sec bins |
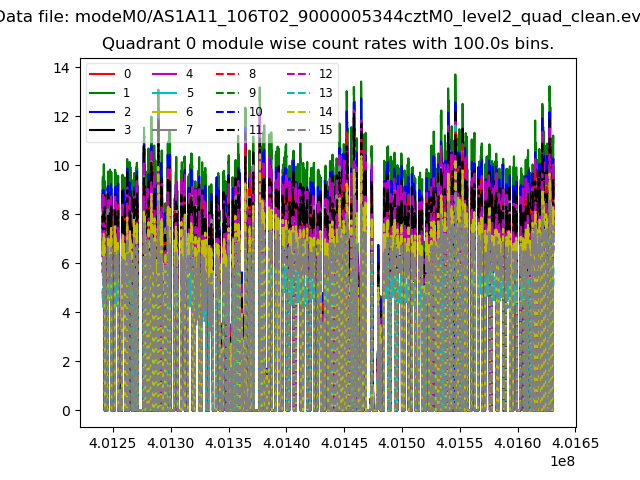 |
 |
| Module-wise count rates for Quadrant B Data is divided into 100 sec bins |
 |
 |
| Module-wise count rates for Quadrant C Data is divided into 100 sec bins |
 |
 |
| Module-wise count rates for Quadrant D Data is divided into 100 sec bins |
 |
 |
| Parameter | Plot |
|---|---|
| CZT HV Monitor |  |
| D_VDD | 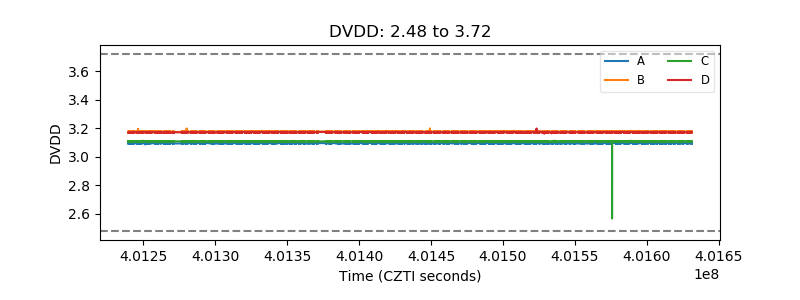 |
| Temperature 1 |  |
| Veto HV Monitor |  |
| Veto LLD |  |
| Alpha Counter | 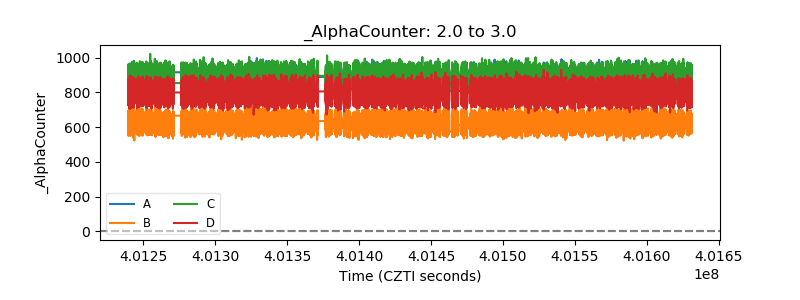 |
| _CPM_Rate |  |
| CZT Counter |  |
| +2.5 Volts monitor | 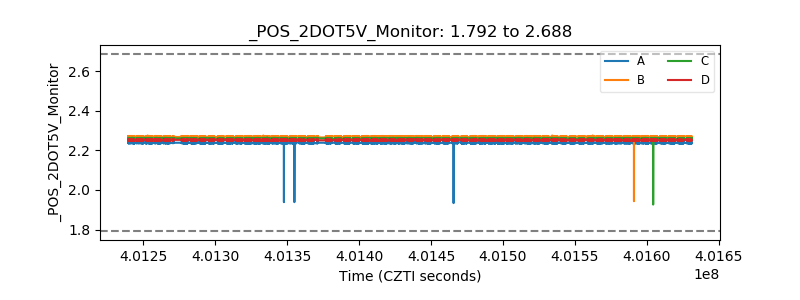 |
| +5 Volts monitor |  |
| _ROLL_ROT |  |
| _Roll_DEC |  |
| _Roll_RA |  |
| Veto Counter |  |