| Param | Original file | Final file |
|---|---|---|
| Filename | modeM0/AS1A11_075T01_9000005342cztM0_level2_bc.evt | modeM0/AS1A11_075T01_9000005342cztM0_level2_quad_clean.evt |
| Size (bytes) | 21,975,410,880 | 6,135,416,640 |
| Size | 20.5 GB | 5.7 GB |
| Events in quadrant A | 197,119,582 | 37,615,543 |
| Events in quadrant B | 120,039,864 | 40,052,613 |
| Events in quadrant C | 117,307,049 | 40,374,505 |
| Events in quadrant D | 200,665,406 | 37,138,061 |
| Mode SS | |||
|---|---|---|---|
| Quadrant | BADHDUFLAG | Total packets | Discarded packets |
| A | 0 | 9160 | 0 |
| B | 0 | 9160 | 0 |
| C | 0 | 9160 | 0 |
| D | 0 | 9160 | 0 |
| Mode M0 | |||
|---|---|---|---|
| Quadrant | BADHDUFLAG | Total packets | Discarded packets |
| A | 0 | 1349246 | 0 |
| B | 0 | 1009188 | 0 |
| C | 0 | 945525 | 0 |
| D | 0 | 1273378 | 0 |
| Mode M9 | |||
|---|---|---|---|
| Quadrant | BADHDUFLAG | Total packets | Discarded packets |
| A | 0 | 1703 | 0 |
| B | 0 | 1703 | 0 |
| C | 0 | 1703 | 0 |
| D | 0 | 1703 | 0 |
| Quadrant | Total seconds | Saturated seconds | Saturation percentage |
|---|---|---|---|
| A | 447668 | 36065 | 8.056193% |
| B | 447668 | 7894 | 1.763360% |
| C | 447668 | 2050 | 0.457929% |
| D | 447668 | 24491 | 5.470795% |
Noise dominated data is calculated using 1-second bins in cleaned event files. If a bin has >2000 counts, and if more than 50% of those come from <1% of pixels, then it is considered to be noise-dominated and hence unusable.
| Quadrant | # 1 sec bins | Bins with >0 counts | Bins with >2000 counts | High rate bins dominated by noise | Noise dominated (total time) | Noise dominated (detector-on time) | Marked lightcurve |
|---|---|---|---|---|---|---|---|
| A | 616976 | 447758 | 573 | 573 | 0.09% | 0.13% | 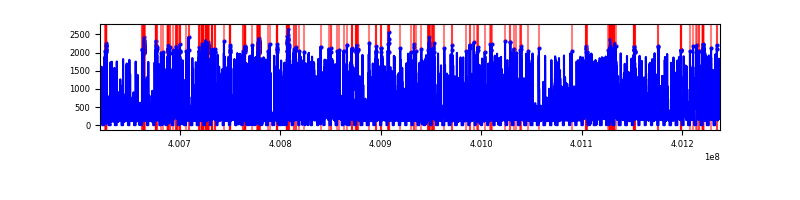 |
| B | 616976 | 447662 | 507 | 507 | 0.08% | 0.11% |  |
| C | 616976 | 447647 | 243 | 243 | 0.04% | 0.05% |  |
| D | 616976 | 447666 | 8901 | 8901 | 1.44% | 1.99% | 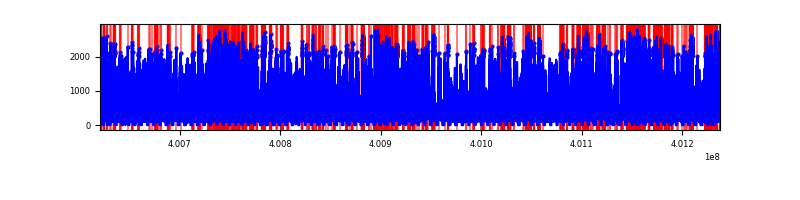 |
Top three noisy pixels from each quadrant. If the there are fewer than three noisy pixels in the level2.evt file, extra rows are filled as -1
| Pixel properties | Quadrant properties | ||||||
|---|---|---|---|---|---|---|---|
| Quadrant | DetID | PixID | Counts | Sigma | Mean | Median | Sigma |
| A | 15 | 222 | 78954799 | 16213.23 | 22074 | 21756 | 4868.4 |
| A | 10 | 83 | 20256422 | 4156.3 | 22074 | 21756 | 4868.4 |
| A | 9 | 143 | 4051918 | 827.81 | 22074 | 21756 | 4868.4 |
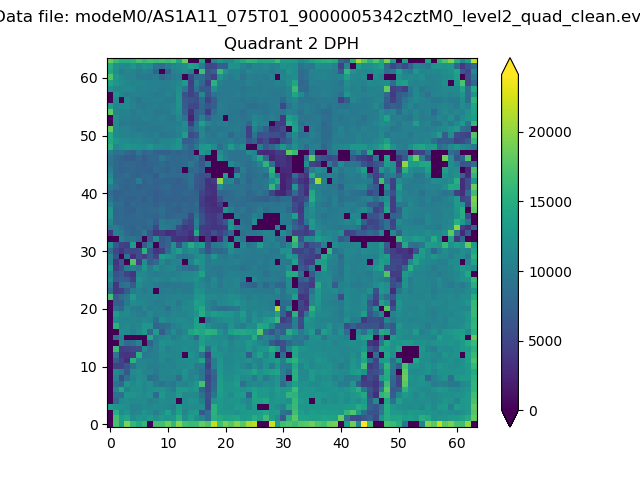
| B | 5 | 172 | 11654156 | 2547.08 | 23253 | 22778 | 4566.6 |
| B | 5 | 255 | 3691757 | 803.45 | 23253 | 22778 | 4566.6 |
| B | 0 | 230 | 2946251 | 640.19 | 23253 | 22778 | 4566.6 |
| C | 15 | 214 | 19130744 | 3688.58 | 22940 | 22816 | 5180.3 |
| C | 0 | 10 | 3828875 | 734.72 | 22940 | 22816 | 5180.3 |
| C | 14 | 254 | 3254273 | 623.8 | 22940 | 22816 | 5180.3 |
| D | 12 | 227 | 56874864 | 10743.8 | 22454 | 21830 | 5291.7 |
| D | 2 | 249 | 17308564 | 3266.76 | 22454 | 21830 | 5291.7 |
| D | 2 | 250 | 7591935 | 1430.56 | 22454 | 21830 | 5291.7 |
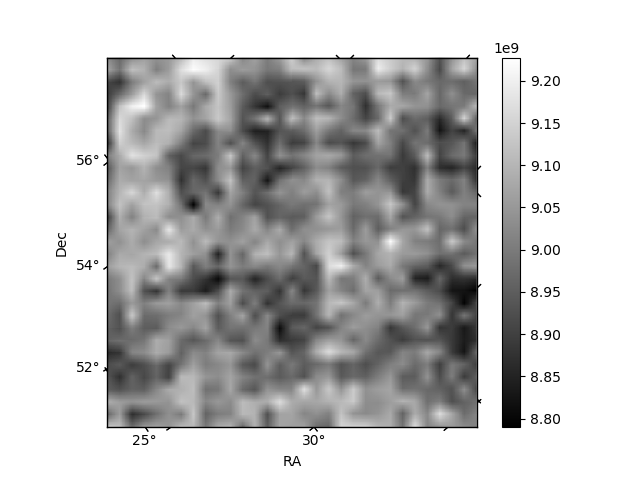
Histogram calculated using DETX and DETY for each event in the final _common_clean file
| Quadrant A |  |
 |
Quadrant B |
|---|---|---|---|
| Quadrant D |  |
 |
Quadrant C |
| Plot type | Count rate plots | Images |
|---|---|---|
| Comparison with Poisson distribution Blue bars denote a histogram of data divided into 1 sec bins. Red curve is a Poisson curve with rate = median count rate of data. |
 |
 |
| Quadrant-wise count rates Data is divided into 100 sec bins |
 |
|
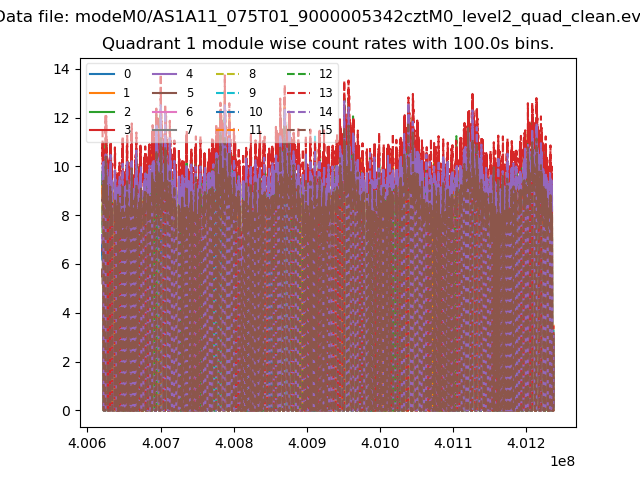
| Module-wise count rates for Quadrant A Data is divided into 100 sec bins |
 |
 |
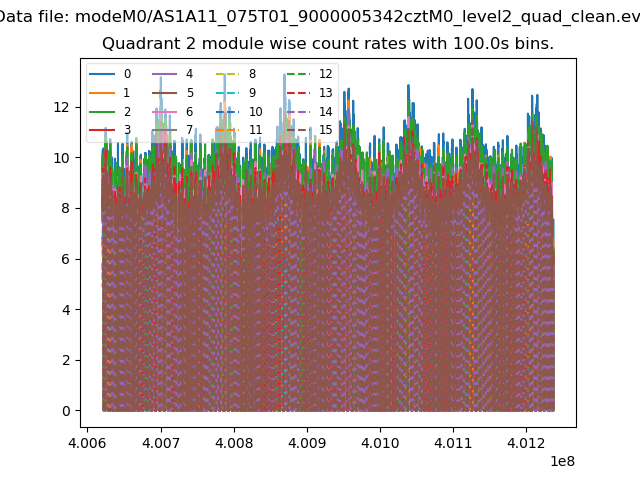
| Module-wise count rates for Quadrant B Data is divided into 100 sec bins |
 |
 |
| Module-wise count rates for Quadrant C Data is divided into 100 sec bins |
 |
 |
| Module-wise count rates for Quadrant D Data is divided into 100 sec bins |
 |
 |
| Parameter | Plot |
|---|---|
| CZT HV Monitor |  |
| D_VDD |  |
| Temperature 1 |  |
| Veto HV Monitor |  |
| Veto LLD |  |
| Alpha Counter |  |
| _CPM_Rate |  |
| CZT Counter |  |
| +2.5 Volts monitor |  |
| +5 Volts monitor |  |
| _ROLL_ROT |  |
| _Roll_DEC | 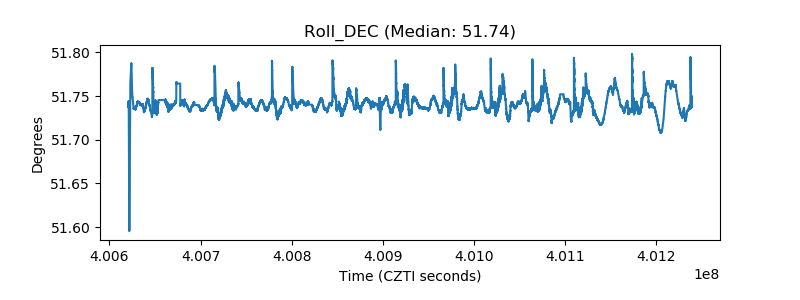 |
| _Roll_RA | 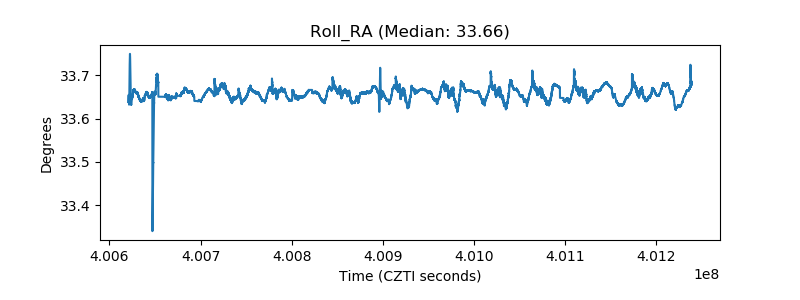 |
| Veto Counter |  |