| Param | Original file | Final file |
|---|---|---|
| Filename | modeM0/AS1A07_093T23_9000005340cztM0_level2_bc.evt | modeM0/AS1A07_093T23_9000005340cztM0_level2_quad_clean.evt |
| Size (bytes) | 286,764,480 | 104,875,200 |
| Size | 273.5 MB | 100.0 MB |
| Events in quadrant A | 1,922,319 | 693,888 |
| Events in quadrant B | 1,898,472 | 694,172 |
| Events in quadrant C | 1,844,515 | 681,341 |
| Events in quadrant D | 2,525,444 | 609,512 |
| Mode SS | |||
|---|---|---|---|
| Quadrant | BADHDUFLAG | Total packets | Discarded packets |
| A | 0 | 146 | 0 |
| B | 0 | 146 | 0 |
| C | 0 | 146 | 0 |
| D | 0 | 146 | 0 |
| Mode M0 | |||
|---|---|---|---|
| Quadrant | BADHDUFLAG | Total packets | Discarded packets |
| A | 0 | 15327 | 0 |
| B | 0 | 15946 | 0 |
| C | 0 | 14924 | 0 |
| D | 0 | 19713 | 0 |
| Mode M9 | |||
|---|---|---|---|
| Quadrant | BADHDUFLAG | Total packets | Discarded packets |
| A | 0 | 40 | 0 |
| B | 0 | 40 | 0 |
| C | 0 | 40 | 0 |
| D | 0 | 40 | 0 |
| Quadrant | Total seconds | Saturated seconds | Saturation percentage |
|---|---|---|---|
| A | 7142 | 13 | 0.182022% |
| B | 7142 | 168 | 2.352282% |
| C | 7142 | 23 | 0.322039% |
| D | 7142 | 489 | 6.846822% |
Noise dominated data is calculated using 1-second bins in cleaned event files. If a bin has >2000 counts, and if more than 50% of those come from <1% of pixels, then it is considered to be noise-dominated and hence unusable.
| Quadrant | # 1 sec bins | Bins with >0 counts | Bins with >2000 counts | High rate bins dominated by noise | Noise dominated (total time) | Noise dominated (detector-on time) | Marked lightcurve |
|---|---|---|---|---|---|---|---|
| A | 11147 | 7144 | 0 | 0 | 0.00% | 0.00% | 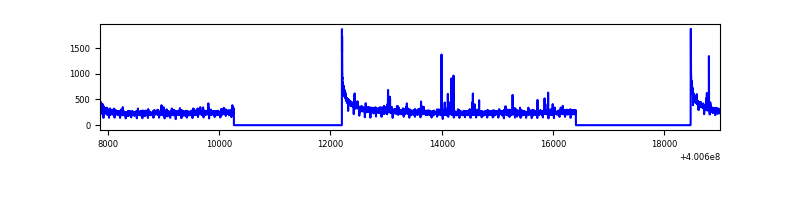 |
| B | 11147 | 7137 | 0 | 0 | 0.00% | 0.00% | 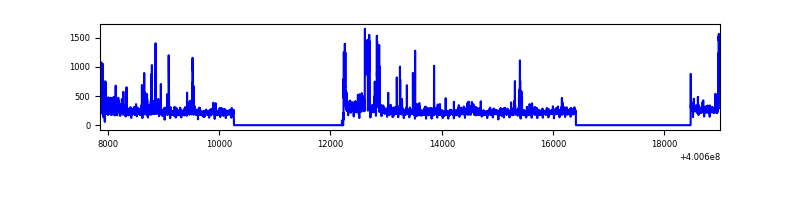 |
| C | 11147 | 7142 | 6 | 6 | 0.05% | 0.08% |  |
| D | 11147 | 7142 | 23 | 23 | 0.21% | 0.32% | 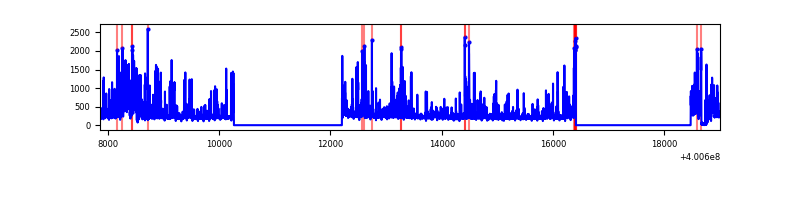 |
Top three noisy pixels from each quadrant. If the there are fewer than three noisy pixels in the level2.evt file, extra rows are filled as -1
| Pixel properties | Quadrant properties | ||||||
|---|---|---|---|---|---|---|---|
| Quadrant | DetID | PixID | Counts | Sigma | Mean | Median | Sigma |
| A | 10 | 83 | 359011 | 4113.44 | 384 | 378 | 87.2 |
| A | 13 | 6 | 22680 | 255.8 | 384 | 378 | 87.2 |
| A | 13 | 248 | 19092 | 214.65 | 384 | 378 | 87.2 |
| B | 5 | 172 | 192739 | 2457.97 | 385 | 376 | 78.3 |
| B | 0 | 230 | 59411 | 754.34 | 385 | 376 | 78.3 |
| B | 5 | 200 | 43717 | 553.8 | 385 | 376 | 78.3 |
| C | 15 | 214 | 287455 | 3340.44 | 371 | 369 | 85.9 |
| C | 0 | 10 | 75392 | 872.94 | 371 | 369 | 85.9 |
| C | 14 | 254 | 24810 | 284.39 | 371 | 369 | 85.9 |
| D | 2 | 249 | 558904 | 6624.45 | 356 | 345 | 84.3 |
| D | 2 | 250 | 189052 | 2238.04 | 356 | 345 | 84.3 |
| D | 12 | 227 | 107413 | 1269.82 | 356 | 345 | 84.3 |
Histogram calculated using DETX and DETY for each event in the final _common_clean file
| Quadrant A |  |
 |
Quadrant B |
|---|---|---|---|
| Quadrant D |  |
 |
Quadrant C |
| Plot type | Count rate plots | Images |
|---|---|---|
| Comparison with Poisson distribution Blue bars denote a histogram of data divided into 1 sec bins. Red curve is a Poisson curve with rate = median count rate of data. |
 |
 |
| Quadrant-wise count rates Data is divided into 100 sec bins |
 |
|
| Module-wise count rates for Quadrant A Data is divided into 100 sec bins |
 |
 |
| Module-wise count rates for Quadrant B Data is divided into 100 sec bins |
 |
 |
| Module-wise count rates for Quadrant C Data is divided into 100 sec bins |
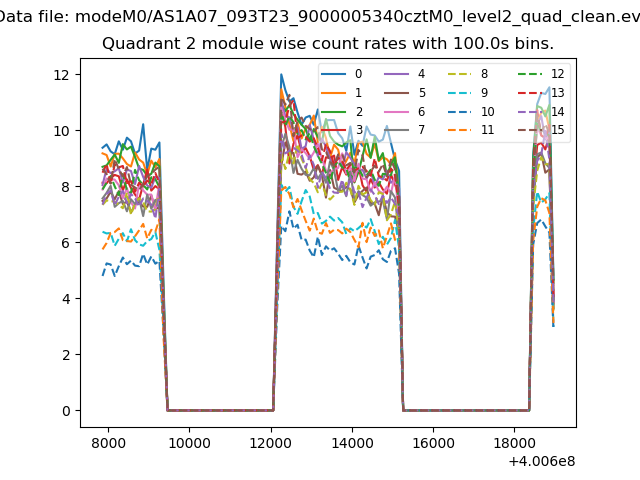 |
 |
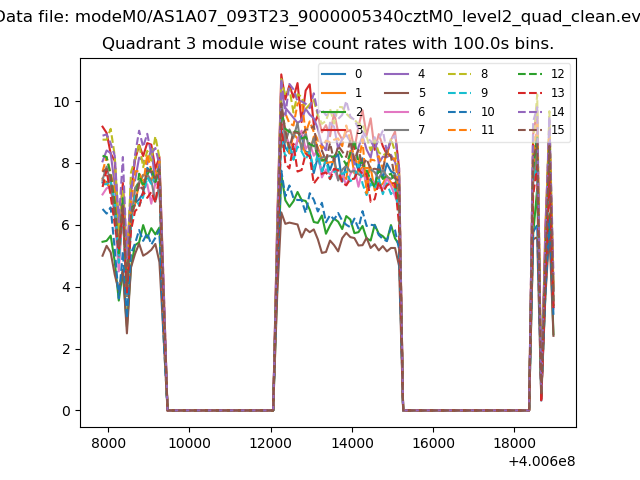
| Module-wise count rates for Quadrant D Data is divided into 100 sec bins |
 |
 |
| Parameter | Plot |
|---|---|
| CZT HV Monitor |  |
| D_VDD |  |
| Temperature 1 | 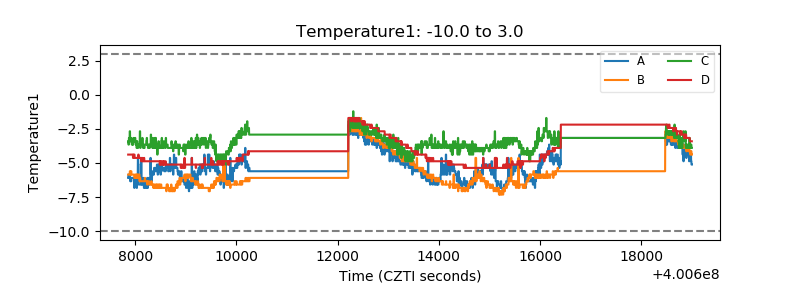 |
| Veto HV Monitor |  |
| Veto LLD | 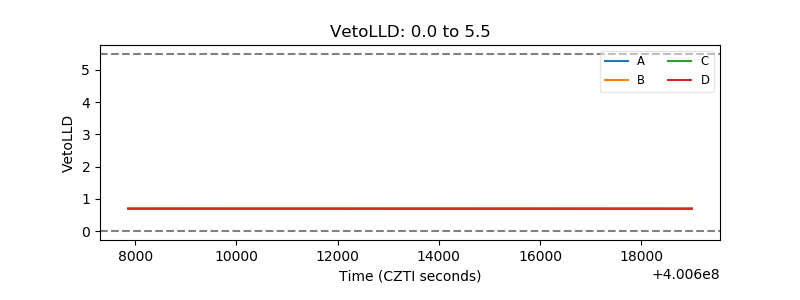 |
| Alpha Counter |  |
| _CPM_Rate |  |
| CZT Counter | 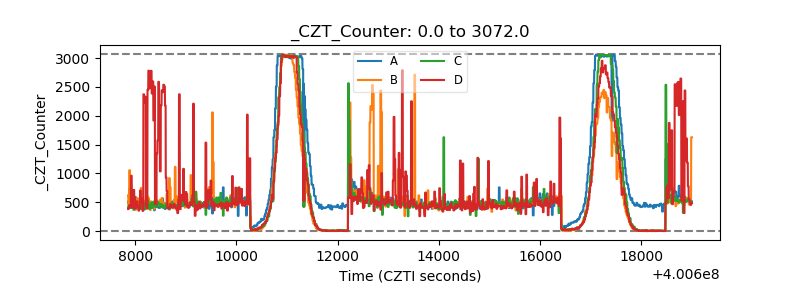 |
| +2.5 Volts monitor |  |
| +5 Volts monitor |  |
| _ROLL_ROT |  |
| _Roll_DEC |  |
| _Roll_RA |  |
| Veto Counter |  |