| Param | Original file | Final file |
|---|---|---|
| Filename | modeM0/AS1T05_053T01_9000005338cztM0_level2_bc.evt | modeM0/AS1T05_053T01_9000005338cztM0_level2_quad_clean.evt |
| Size (bytes) | 6,051,199,680 | 1,813,397,760 |
| Size | 5.6 GB | 1.7 GB |
| Events in quadrant A | 39,212,846 | 11,507,615 |
| Events in quadrant B | 44,802,104 | 11,419,370 |
| Events in quadrant C | 36,058,233 | 11,631,225 |
| Events in quadrant D | 53,617,228 | 10,722,452 |
| Mode SS | |||
|---|---|---|---|
| Quadrant | BADHDUFLAG | Total packets | Discarded packets |
| A | 0 | 2874 | 0 |
| B | 0 | 2874 | 0 |
| C | 0 | 2874 | 0 |
| D | 0 | 2874 | 0 |
| Mode M0 | |||
|---|---|---|---|
| Quadrant | BADHDUFLAG | Total packets | Discarded packets |
| A | 0 | 307645 | 0 |
| B | 0 | 344278 | 0 |
| C | 0 | 295520 | 0 |
| D | 0 | 380459 | 0 |
| Mode M9 | |||
|---|---|---|---|
| Quadrant | BADHDUFLAG | Total packets | Discarded packets |
| A | 0 | 536 | 0 |
| B | 0 | 536 | 0 |
| C | 0 | 536 | 0 |
| D | 0 | 537 | 0 |
| Quadrant | Total seconds | Saturated seconds | Saturation percentage |
|---|---|---|---|
| A | 140785 | 743 | 0.527755% |
| B | 140786 | 4762 | 3.382439% |
| C | 140786 | 681 | 0.483713% |
| D | 140786 | 7072 | 5.023227% |
Noise dominated data is calculated using 1-second bins in cleaned event files. If a bin has >2000 counts, and if more than 50% of those come from <1% of pixels, then it is considered to be noise-dominated and hence unusable.
| Quadrant | # 1 sec bins | Bins with >0 counts | Bins with >2000 counts | High rate bins dominated by noise | Noise dominated (total time) | Noise dominated (detector-on time) | Marked lightcurve |
|---|---|---|---|---|---|---|---|
| A | 198466 | 140813 | 31 | 31 | 0.02% | 0.02% | 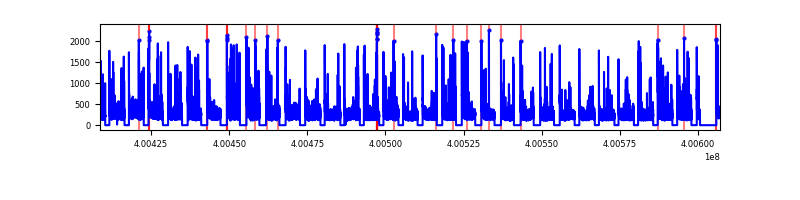 |
| B | 198466 | 140774 | 295 | 295 | 0.15% | 0.21% |  |
| C | 198466 | 140787 | 59 | 59 | 0.03% | 0.04% | 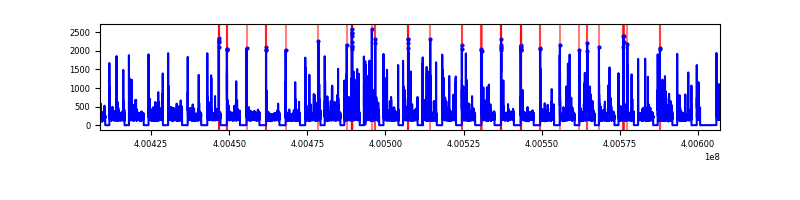 |
| D | 198466 | 140773 | 944 | 944 | 0.48% | 0.67% |  |
Top three noisy pixels from each quadrant. If the there are fewer than three noisy pixels in the level2.evt file, extra rows are filled as -1
| Pixel properties | Quadrant properties | ||||||
|---|---|---|---|---|---|---|---|
| Quadrant | DetID | PixID | Counts | Sigma | Mean | Median | Sigma |
| A | 10 | 83 | 6846951 | 4322.69 | 7042 | 6924 | 1582.4 |
| A | 15 | 222 | 2105328 | 1326.13 | 7042 | 6924 | 1582.4 |
| A | 9 | 143 | 1014192 | 636.56 | 7042 | 6924 | 1582.4 |
| B | 5 | 255 | 5703035 | 4055.31 | 7035 | 6874 | 1404.6 |
| B | 5 | 172 | 4432903 | 3151.05 | 7035 | 6874 | 1404.6 |
| B | 5 | 200 | 1382538 | 979.39 | 7035 | 6874 | 1404.6 |
| C | 15 | 214 | 5729333 | 3564.34 | 6919 | 6858 | 1605.5 |
| C | 0 | 10 | 1712936 | 1062.66 | 6919 | 6858 | 1605.5 |
| C | 14 | 254 | 721257 | 444.98 | 6919 | 6858 | 1605.5 |
| D | 2 | 249 | 7007594 | 4276.97 | 6784 | 6568 | 1636.9 |
| D | 10 | 253 | 4001422 | 2440.48 | 6784 | 6568 | 1636.9 |
| D | 2 | 250 | 3600408 | 2195.5 | 6784 | 6568 | 1636.9 |
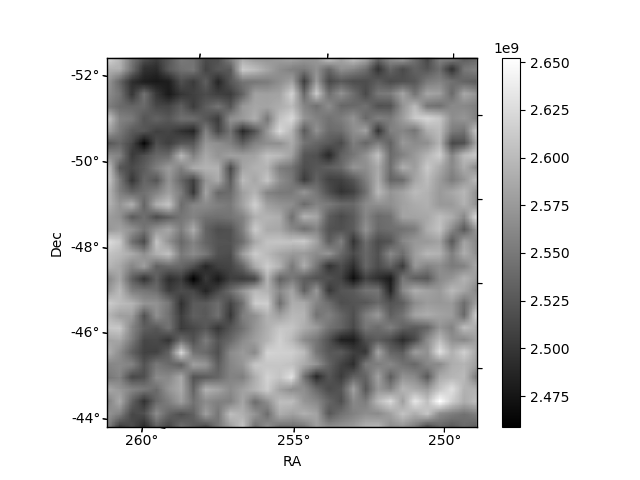
Histogram calculated using DETX and DETY for each event in the final _common_clean file
| Quadrant A |  |
 |
Quadrant B |
|---|---|---|---|
| Quadrant D |  |
 |
Quadrant C |
| Plot type | Count rate plots | Images |
|---|---|---|
| Comparison with Poisson distribution Blue bars denote a histogram of data divided into 1 sec bins. Red curve is a Poisson curve with rate = median count rate of data. |
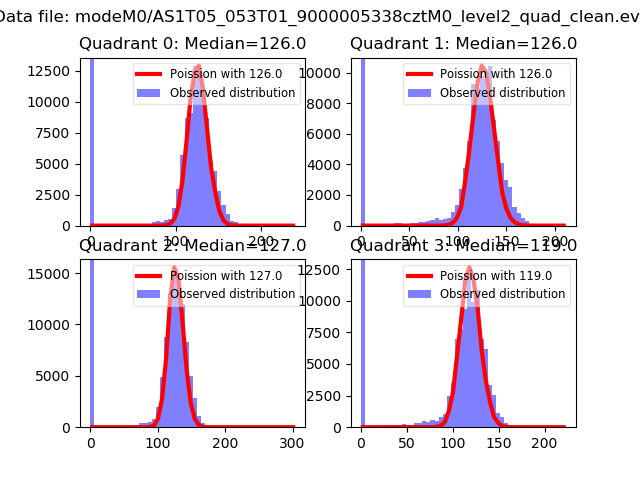 |
 |
| Quadrant-wise count rates Data is divided into 100 sec bins |
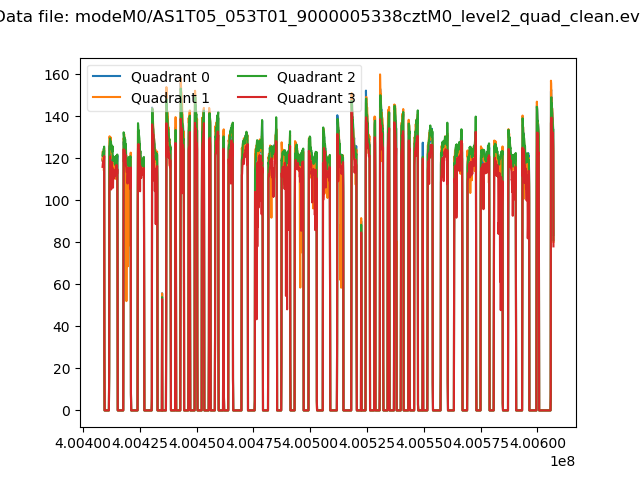 |
|
| Module-wise count rates for Quadrant A Data is divided into 100 sec bins |
 |
 |
| Module-wise count rates for Quadrant B Data is divided into 100 sec bins |
 |
 |
| Module-wise count rates for Quadrant C Data is divided into 100 sec bins |
 |
 |
| Module-wise count rates for Quadrant D Data is divided into 100 sec bins |
 |
 |
| Parameter | Plot |
|---|---|
| CZT HV Monitor |  |
| D_VDD | 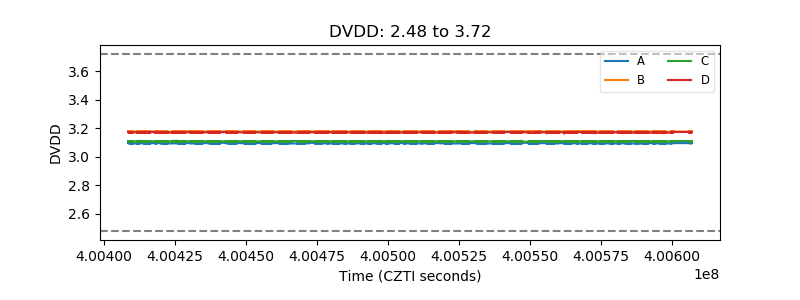 |
| Temperature 1 |  |
| Veto HV Monitor |  |
| Veto LLD |  |
| Alpha Counter |  |
| _CPM_Rate |  |
| CZT Counter | 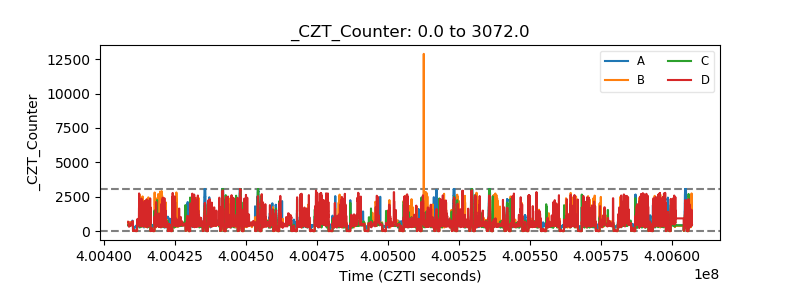 |
| +2.5 Volts monitor |  |
| +5 Volts monitor |  |
| _ROLL_ROT |  |
| _Roll_DEC |  |
| _Roll_RA |  |
| Veto Counter |  |