| Param | Original file | Final file |
|---|---|---|
| Filename | modeM0/AS1T05_051T01_9000005334cztM0_level2_bc.evt | modeM0/AS1T05_051T01_9000005334cztM0_level2_quad_clean.evt |
| Size (bytes) | 2,899,431,360 | 834,736,320 |
| Size | 2.7 GB | 796.1 MB |
| Events in quadrant A | 21,434,867 | 5,235,768 |
| Events in quadrant B | 18,258,110 | 5,324,904 |
| Events in quadrant C | 18,817,035 | 5,304,737 |
| Events in quadrant D | 24,870,813 | 4,952,858 |
| Mode M9 | |||
|---|---|---|---|
| Quadrant | BADHDUFLAG | Total packets | Discarded packets |
| A | 0 | 249 | 0 |
| B | 0 | 247 | 0 |
| C | 0 | 250 | 0 |
| D | 0 | 249 | 0 |
| Mode M0 | |||
|---|---|---|---|
| Quadrant | BADHDUFLAG | Total packets | Discarded packets |
| A | 0 | 156845 | 0 |
| B | 0 | 148495 | 0 |
| C | 0 | 145728 | 0 |
| D | 0 | 174356 | 0 |
| Mode SS | |||
|---|---|---|---|
| Quadrant | BADHDUFLAG | Total packets | Discarded packets |
| A | 0 | 1334 | 0 |
| B | 0 | 1333 | 0 |
| C | 0 | 1334 | 0 |
| D | 0 | 1338 | 0 |
| Quadrant | Total seconds | Saturated seconds | Saturation percentage |
|---|---|---|---|
| A | 64899 | 999 | 1.539315% |
| B | 65183 | 1038 | 1.592440% |
| C | 65184 | 994 | 1.524914% |
| D | 65055 | 2588 | 3.978172% |
Noise dominated data is calculated using 1-second bins in cleaned event files. If a bin has >2000 counts, and if more than 50% of those come from <1% of pixels, then it is considered to be noise-dominated and hence unusable.
| Quadrant | # 1 sec bins | Bins with >0 counts | Bins with >2000 counts | High rate bins dominated by noise | Noise dominated (total time) | Noise dominated (detector-on time) | Marked lightcurve |
|---|---|---|---|---|---|---|---|
| A | 91455 | 65339 | 47 | 47 | 0.05% | 0.07% | 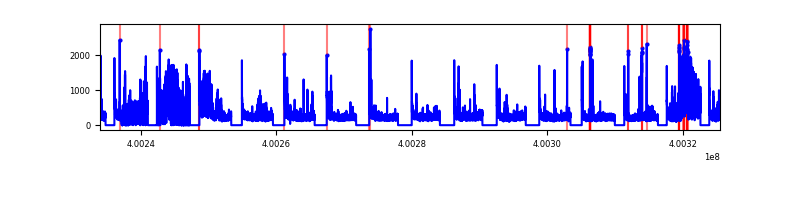 |
| B | 91455 | 65611 | 108 | 108 | 0.12% | 0.16% |  |
| C | 91455 | 65647 | 126 | 126 | 0.14% | 0.19% |  |
| D | 91455 | 65531 | 297 | 297 | 0.32% | 0.45% | 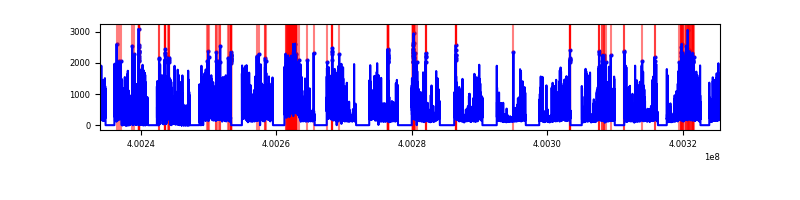 |
Top three noisy pixels from each quadrant. If the there are fewer than three noisy pixels in the level2.evt file, extra rows are filled as -1
| Pixel properties | Quadrant properties | ||||||
|---|---|---|---|---|---|---|---|
| Quadrant | DetID | PixID | Counts | Sigma | Mean | Median | Sigma |
| A | 15 | 222 | 4821036 | 6568.37 | 3249 | 3189 | 733.5 |
| A | 10 | 83 | 3003492 | 4090.44 | 3249 | 3189 | 733.5 |
| A | 6 | 10 | 404269 | 546.81 | 3249 | 3189 | 733.5 |
| B | 5 | 172 | 1008249 | 1525.79 | 3305 | 3231 | 658.7 |
| B | 5 | 255 | 677306 | 1023.36 | 3305 | 3231 | 658.7 |
| B | 0 | 221 | 475738 | 717.35 | 3305 | 3231 | 658.7 |
| C | 15 | 214 | 2630354 | 3554.23 | 3206 | 3187 | 739.2 |
| C | 14 | 254 | 2010656 | 2715.86 | 3206 | 3187 | 739.2 |
| C | 0 | 10 | 694886 | 935.78 | 3206 | 3187 | 739.2 |
| D | 2 | 249 | 3662305 | 4825.32 | 3159 | 3062 | 758.3 |
| D | 12 | 235 | 3420028 | 4505.84 | 3159 | 3062 | 758.3 |
| D | 13 | 249 | 931979 | 1224.93 | 3159 | 3062 | 758.3 |
Histogram calculated using DETX and DETY for each event in the final _common_clean file
| Quadrant A |  |
 |
Quadrant B |
|---|---|---|---|
| Quadrant D |  |
 |
Quadrant C |
| Plot type | Count rate plots | Images |
|---|---|---|
| Comparison with Poisson distribution Blue bars denote a histogram of data divided into 1 sec bins. Red curve is a Poisson curve with rate = median count rate of data. |
 |
 |
| Quadrant-wise count rates Data is divided into 100 sec bins |
 |
|
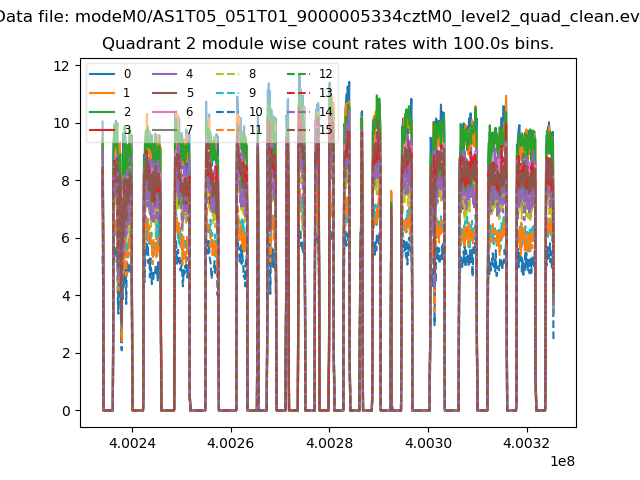
| Module-wise count rates for Quadrant A Data is divided into 100 sec bins |
 |
 |
| Module-wise count rates for Quadrant B Data is divided into 100 sec bins |
 |
 |
| Module-wise count rates for Quadrant C Data is divided into 100 sec bins |
 |
 |
| Module-wise count rates for Quadrant D Data is divided into 100 sec bins |
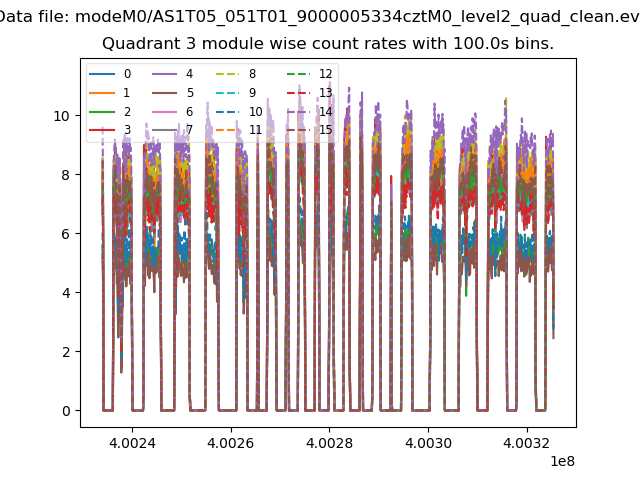 |
 |
| Parameter | Plot |
|---|---|
| CZT HV Monitor |  |
| D_VDD |  |
| Temperature 1 |  |
| Veto HV Monitor |  |
| Veto LLD |  |
| Alpha Counter | 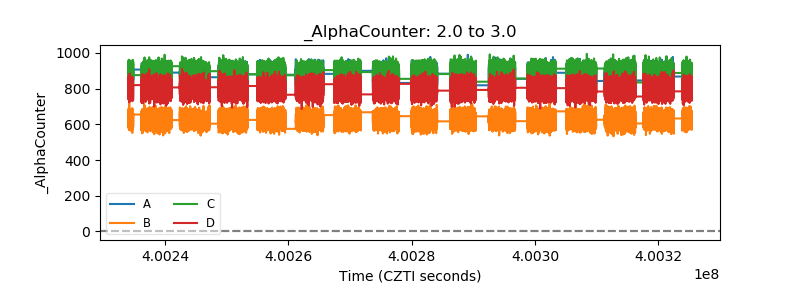 |
| _CPM_Rate | 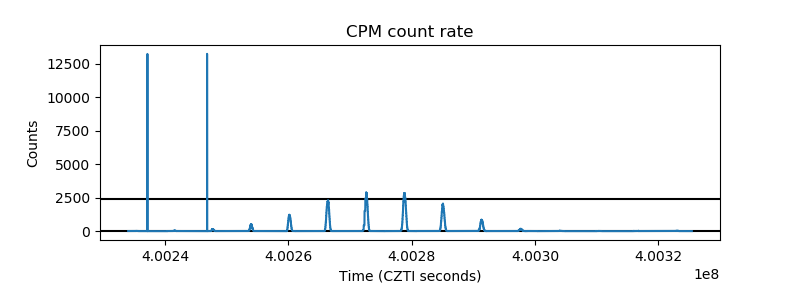 |
| CZT Counter | 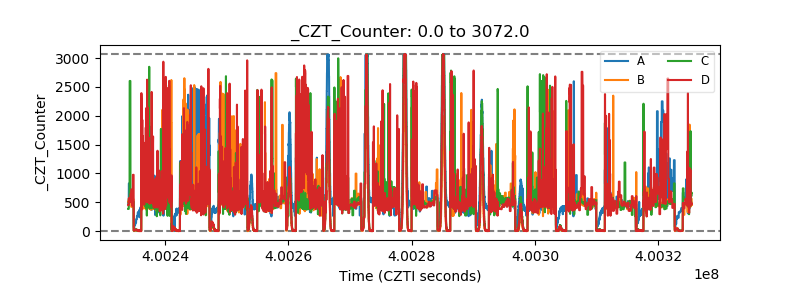 |
| +2.5 Volts monitor |  |
| +5 Volts monitor |  |
| _ROLL_ROT |  |
| _Roll_DEC |  |
| _Roll_RA |  |
| Veto Counter | 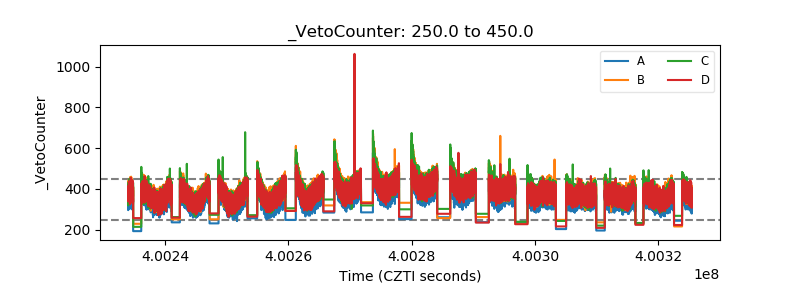 |