| Param | Original file | Final file |
|---|---|---|
| Filename | modeM0/AS1A10_113T02_9000005332cztM0_level2_bc.evt | modeM0/AS1A10_113T02_9000005332cztM0_level2_quad_clean.evt |
| Size (bytes) | 1,189,851,840 | 303,301,440 |
| Size | 1.1 GB | 289.3 MB |
| Events in quadrant A | 9,193,111 | 1,968,072 |
| Events in quadrant B | 6,161,183 | 1,971,962 |
| Events in quadrant C | 5,966,683 | 1,965,850 |
| Events in quadrant D | 13,132,679 | 1,684,180 |
| Mode SS | |||
|---|---|---|---|
| Quadrant | BADHDUFLAG | Total packets | Discarded packets |
| A | 0 | 474 | 0 |
| B | 0 | 474 | 0 |
| C | 0 | 474 | 0 |
| D | 0 | 474 | 0 |
| Mode M9 | |||
|---|---|---|---|
| Quadrant | BADHDUFLAG | Total packets | Discarded packets |
| A | 0 | 89 | 0 |
| B | 0 | 89 | 0 |
| C | 0 | 89 | 0 |
| D | 0 | 89 | 0 |
| Mode M0 | |||
|---|---|---|---|
| Quadrant | BADHDUFLAG | Total packets | Discarded packets |
| A | 0 | 61376 | 0 |
| B | 0 | 51646 | 0 |
| C | 0 | 48605 | 0 |
| D | 0 | 77350 | 0 |
| Quadrant | Total seconds | Saturated seconds | Saturation percentage |
|---|---|---|---|
| A | 23182 | 217 | 0.936071% |
| B | 23182 | 329 | 1.419205% |
| C | 23182 | 97 | 0.418428% |
| D | 23182 | 3009 | 12.979898% |
Noise dominated data is calculated using 1-second bins in cleaned event files. If a bin has >2000 counts, and if more than 50% of those come from <1% of pixels, then it is considered to be noise-dominated and hence unusable.
| Quadrant | # 1 sec bins | Bins with >0 counts | Bins with >2000 counts | High rate bins dominated by noise | Noise dominated (total time) | Noise dominated (detector-on time) | Marked lightcurve |
|---|---|---|---|---|---|---|---|
| A | 32148 | 23187 | 10 | 10 | 0.03% | 0.04% |  |
| B | 32148 | 23181 | 14 | 14 | 0.04% | 0.06% |  |
| C | 32148 | 23182 | 16 | 16 | 0.05% | 0.07% |  |
| D | 32147 | 23171 | 1220 | 1220 | 3.80% | 5.27% | 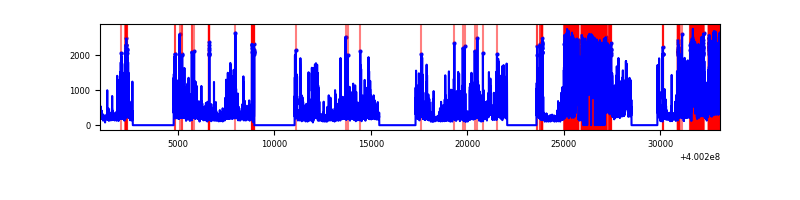 |
Top three noisy pixels from each quadrant. If the there are fewer than three noisy pixels in the level2.evt file, extra rows are filled as -1
| Pixel properties | Quadrant properties | ||||||
|---|---|---|---|---|---|---|---|
| Quadrant | DetID | PixID | Counts | Sigma | Mean | Median | Sigma |
| A | 15 | 222 | 3267244 | 12674.21 | 1157 | 1138 | 257.7 |
| A | 10 | 83 | 1052510 | 4079.88 | 1157 | 1138 | 257.7 |
| A | 12 | 189 | 127259 | 489.42 | 1157 | 1138 | 257.7 |
| B | 5 | 172 | 526597 | 2269.38 | 1164 | 1140 | 231.5 |
| B | 5 | 255 | 410346 | 1767.31 | 1164 | 1140 | 231.5 |
| B | 0 | 219 | 109341 | 467.31 | 1164 | 1140 | 231.5 |
| C | 15 | 214 | 942778 | 3528.28 | 1145 | 1134 | 266.9 |
| C | 14 | 254 | 311426 | 1162.65 | 1145 | 1134 | 266.9 |
| C | 0 | 10 | 151933 | 565.03 | 1145 | 1134 | 266.9 |
| D | 12 | 227 | 5369521 | 20919.45 | 1074 | 1041 | 256.6 |
| D | 2 | 249 | 1044549 | 4066.26 | 1074 | 1041 | 256.6 |
| D | 12 | 233 | 695557 | 2706.33 | 1074 | 1041 | 256.6 |
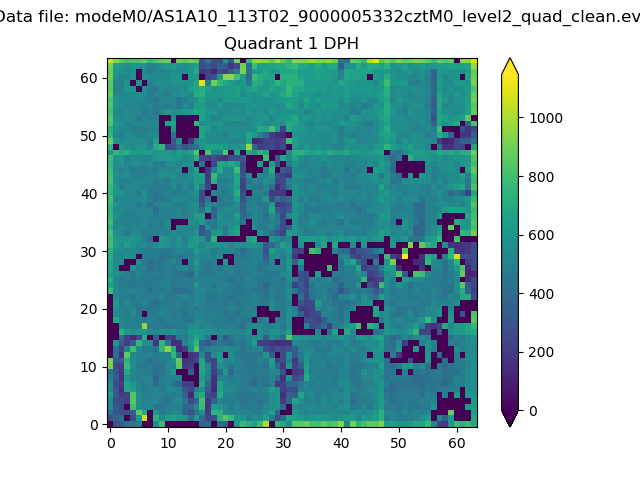
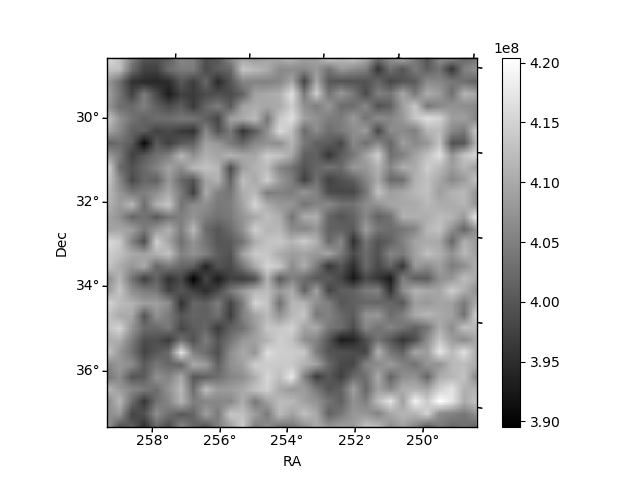
Histogram calculated using DETX and DETY for each event in the final _common_clean file
| Quadrant A |  |
 |
Quadrant B |
|---|---|---|---|
| Quadrant D | 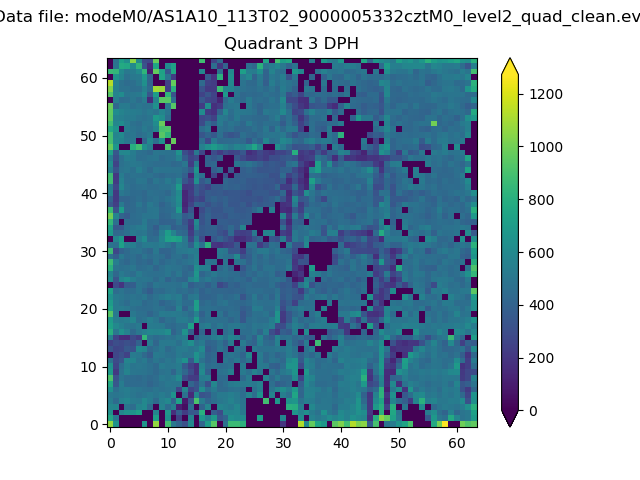 |
 |
Quadrant C |
| Plot type | Count rate plots | Images |
|---|---|---|
| Comparison with Poisson distribution Blue bars denote a histogram of data divided into 1 sec bins. Red curve is a Poisson curve with rate = median count rate of data. |
 |
 |
| Quadrant-wise count rates Data is divided into 100 sec bins |
 |
|
| Module-wise count rates for Quadrant A Data is divided into 100 sec bins |
 |
 |
| Module-wise count rates for Quadrant B Data is divided into 100 sec bins |
 |
 |
| Module-wise count rates for Quadrant C Data is divided into 100 sec bins |
 |
 |
| Module-wise count rates for Quadrant D Data is divided into 100 sec bins |
 |
 |
| Parameter | Plot |
|---|---|
| CZT HV Monitor |  |
| D_VDD |  |
| Temperature 1 | 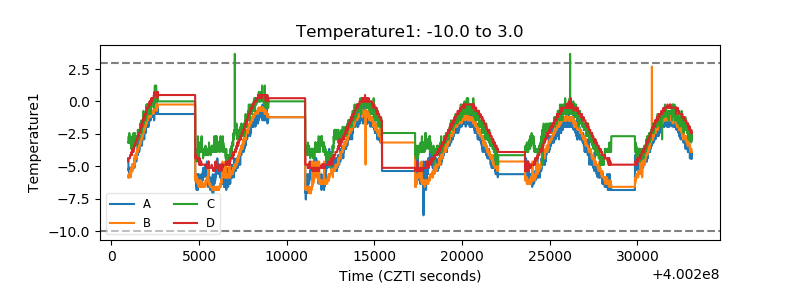 |
| Veto HV Monitor |  |
| Veto LLD | 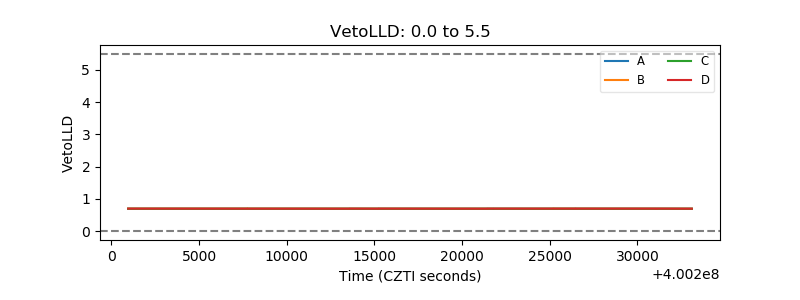 |
| Alpha Counter | 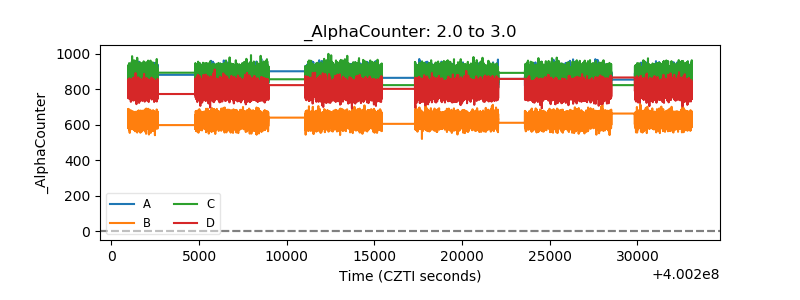 |
| _CPM_Rate |  |
| CZT Counter |  |
| +2.5 Volts monitor |  |
| +5 Volts monitor |  |
| _ROLL_ROT |  |
| _Roll_DEC |  |
| _Roll_RA |  |
| Veto Counter |  |