| Param | Original file | Final file |
|---|---|---|
| Filename | modeM0/AS1A09_061T01_9000005330cztM0_level2_bc.evt | modeM0/AS1A09_061T01_9000005330cztM0_level2_quad_clean.evt |
| Size (bytes) | 3,803,901,120 | 981,011,520 |
| Size | 3.5 GB | 935.6 MB |
| Events in quadrant A | 22,189,221 | 6,297,006 |
| Events in quadrant B | 21,976,268 | 6,392,213 |
| Events in quadrant C | 21,968,053 | 6,347,105 |
| Events in quadrant D | 44,042,612 | 5,609,694 |
| Mode SS | |||
|---|---|---|---|
| Quadrant | BADHDUFLAG | Total packets | Discarded packets |
| A | 0 | 1522 | 0 |
| B | 0 | 1521 | 0 |
| C | 0 | 1521 | 0 |
| D | 0 | 1522 | 0 |
| Mode M9 | |||
|---|---|---|---|
| Quadrant | BADHDUFLAG | Total packets | Discarded packets |
| A | 0 | 304 | 0 |
| B | 0 | 303 | 0 |
| C | 0 | 304 | 0 |
| D | 0 | 305 | 0 |
| Mode M0 | |||
|---|---|---|---|
| Quadrant | BADHDUFLAG | Total packets | Discarded packets |
| A | 0 | 169721 | 0 |
| B | 0 | 176441 | 0 |
| C | 0 | 167425 | 0 |
| D | 0 | 262056 | 0 |
| Quadrant | Total seconds | Saturated seconds | Saturation percentage |
|---|---|---|---|
| A | 73860 | 543 | 0.735175% |
| B | 73935 | 2203 | 2.979644% |
| C | 73869 | 1027 | 1.390299% |
| D | 73760 | 11893 | 16.123915% |
Noise dominated data is calculated using 1-second bins in cleaned event files. If a bin has >2000 counts, and if more than 50% of those come from <1% of pixels, then it is considered to be noise-dominated and hence unusable.
| Quadrant | # 1 sec bins | Bins with >0 counts | Bins with >2000 counts | High rate bins dominated by noise | Noise dominated (total time) | Noise dominated (detector-on time) | Marked lightcurve |
|---|---|---|---|---|---|---|---|
| A | 116483 | 74365 | 30 | 30 | 0.03% | 0.04% |  |
| B | 116483 | 74382 | 68 | 68 | 0.06% | 0.09% |  |
| C | 116483 | 74362 | 160 | 160 | 0.14% | 0.22% |  |
| D | 116483 | 74156 | 4640 | 4640 | 3.98% | 6.26% | 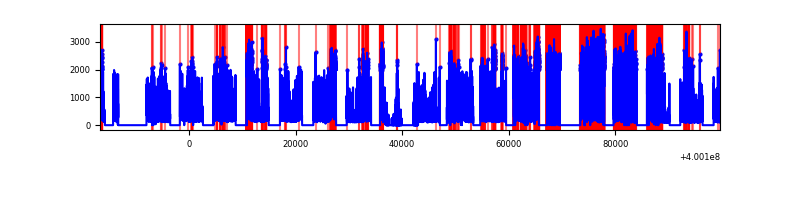 |
Top three noisy pixels from each quadrant. If the there are fewer than three noisy pixels in the level2.evt file, extra rows are filled as -1
| Pixel properties | Quadrant properties | ||||||
|---|---|---|---|---|---|---|---|
| Quadrant | DetID | PixID | Counts | Sigma | Mean | Median | Sigma |
| A | 10 | 83 | 3597276 | 4145.28 | 3831 | 3753 | 866.9 |
| A | 15 | 222 | 1995731 | 2297.83 | 3831 | 3753 | 866.9 |
| A | 13 | 248 | 565747 | 648.28 | 3831 | 3753 | 866.9 |
| B | 5 | 172 | 3284684 | 4280.26 | 3850 | 3762 | 766.5 |
| B | 0 | 229 | 744165 | 965.92 | 3850 | 3762 | 766.5 |
| B | 0 | 213 | 660412 | 856.66 | 3850 | 3762 | 766.5 |
| C | 15 | 214 | 2996642 | 3445.03 | 3777 | 3743 | 868.8 |
| C | 14 | 254 | 2620590 | 3012.17 | 3777 | 3743 | 868.8 |
| C | 0 | 10 | 771267 | 883.47 | 3777 | 3743 | 868.8 |
| D | 12 | 227 | 17786619 | 22075.36 | 3451 | 3334 | 805.6 |
| D | 2 | 249 | 4139124 | 5133.98 | 3451 | 3334 | 805.6 |
| D | 12 | 233 | 2664739 | 3303.75 | 3451 | 3334 | 805.6 |
Histogram calculated using DETX and DETY for each event in the final _common_clean file
| Quadrant A | 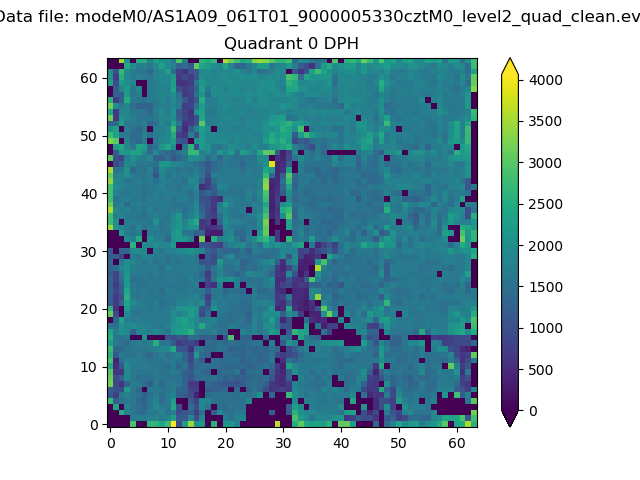 |
 |
Quadrant B |
|---|---|---|---|
| Quadrant D | 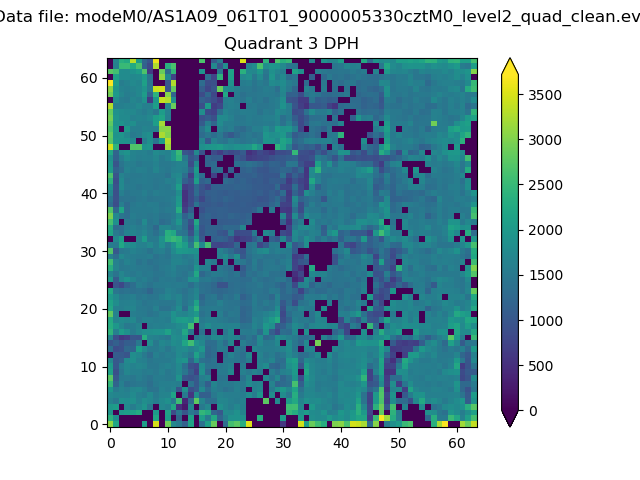 |
 |
Quadrant C |
| Plot type | Count rate plots | Images |
|---|---|---|
| Comparison with Poisson distribution Blue bars denote a histogram of data divided into 1 sec bins. Red curve is a Poisson curve with rate = median count rate of data. |
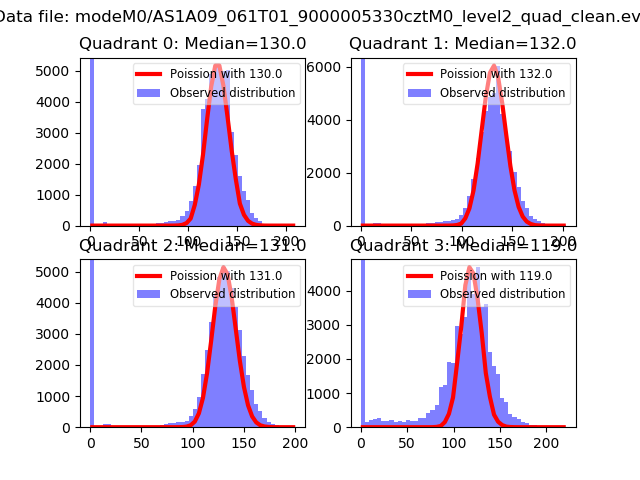 |
 |
| Quadrant-wise count rates Data is divided into 100 sec bins |
 |
|
| Module-wise count rates for Quadrant A Data is divided into 100 sec bins |
 |
 |
| Module-wise count rates for Quadrant B Data is divided into 100 sec bins |
 |
 |
| Module-wise count rates for Quadrant C Data is divided into 100 sec bins |
 |
 |
| Module-wise count rates for Quadrant D Data is divided into 100 sec bins |
 |
 |
| Parameter | Plot |
|---|---|
| CZT HV Monitor |  |
| D_VDD |  |
| Temperature 1 |  |
| Veto HV Monitor |  |
| Veto LLD |  |
| Alpha Counter |  |
| _CPM_Rate |  |
| CZT Counter |  |
| +2.5 Volts monitor |  |
| +5 Volts monitor | 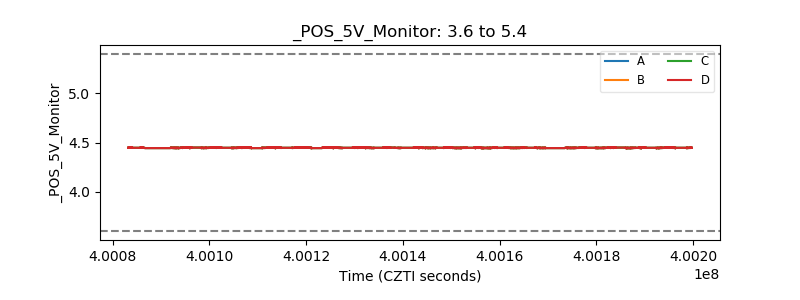 |
| _ROLL_ROT |  |
| _Roll_DEC | 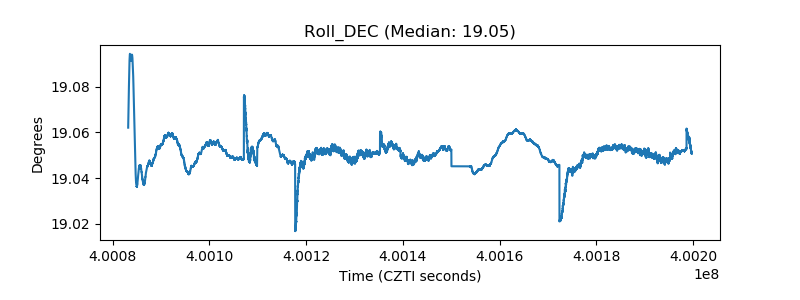 |
| _Roll_RA | 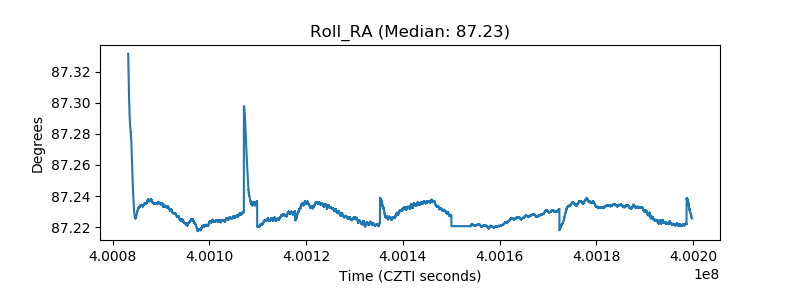 |
| Veto Counter |  |