| Param | Original file | Final file |
|---|---|---|
| Filename | modeM0/AS1C07_001T11_9000005326cztM0_level2_bc.evt | modeM0/AS1C07_001T11_9000005326cztM0_level2_quad_clean.evt |
| Size (bytes) | 3,443,382,720 | 1,228,867,200 |
| Size | 3.2 GB | 1.1 GB |
| Events in quadrant A | 26,290,944 | 8,131,211 |
| Events in quadrant B | 21,618,267 | 8,411,371 |
| Events in quadrant C | 20,337,541 | 8,341,975 |
| Events in quadrant D | 31,429,839 | 7,691,378 |
| Mode M0 | |||
|---|---|---|---|
| Quadrant | BADHDUFLAG | Total packets | Discarded packets |
| A | 0 | 180752 | 0 |
| B | 0 | 167697 | 0 |
| C | 0 | 154431 | 0 |
| D | 0 | 208538 | 0 |
| Mode M9 | |||
|---|---|---|---|
| Quadrant | BADHDUFLAG | Total packets | Discarded packets |
| A | 0 | 263 | 0 |
| B | 0 | 263 | 0 |
| C | 0 | 263 | 0 |
| D | 0 | 263 | 0 |
| Mode SS | |||
|---|---|---|---|
| Quadrant | BADHDUFLAG | Total packets | Discarded packets |
| A | 0 | 1388 | 0 |
| B | 0 | 1388 | 0 |
| C | 0 | 1388 | 0 |
| D | 0 | 1388 | 0 |
| Quadrant | Total seconds | Saturated seconds | Saturation percentage |
|---|---|---|---|
| A | 67719 | 3467 | 5.119686% |
| B | 67718 | 2683 | 3.962019% |
| C | 67719 | 1540 | 2.274103% |
| D | 67717 | 6490 | 9.584004% |
Noise dominated data is calculated using 1-second bins in cleaned event files. If a bin has >2000 counts, and if more than 50% of those come from <1% of pixels, then it is considered to be noise-dominated and hence unusable.
| Quadrant | # 1 sec bins | Bins with >0 counts | Bins with >2000 counts | High rate bins dominated by noise | Noise dominated (total time) | Noise dominated (detector-on time) | Marked lightcurve |
|---|---|---|---|---|---|---|---|
| A | 94157 | 67716 | 927 | 927 | 0.98% | 1.37% |  |
| B | 94157 | 67716 | 182 | 182 | 0.19% | 0.27% |  |
| C | 94157 | 67671 | 266 | 266 | 0.28% | 0.39% |  |
| D | 94157 | 67698 | 1547 | 1547 | 1.64% | 2.29% |  |
Top three noisy pixels from each quadrant. If the there are fewer than three noisy pixels in the level2.evt file, extra rows are filled as -1
| Pixel properties | Quadrant properties | ||||||
|---|---|---|---|---|---|---|---|
| Quadrant | DetID | PixID | Counts | Sigma | Mean | Median | Sigma |
| A | 15 | 222 | 7880702 | 10764.69 | 3271 | 3228 | 731.8 |
| A | 10 | 83 | 2922234 | 3988.87 | 3271 | 3228 | 731.8 |
| A | 15 | 190 | 944755 | 1286.61 | 3271 | 3228 | 731.8 |
| B | 5 | 172 | 3899011 | 5778.01 | 3362 | 3293 | 674.2 |
| B | 15 | 35 | 1381209 | 2043.68 | 3362 | 3293 | 674.2 |
| B | 5 | 255 | 1084043 | 1602.94 | 3362 | 3293 | 674.2 |
| C | 15 | 214 | 2704449 | 3541.04 | 3289 | 3278 | 762.8 |
| C | 14 | 254 | 2484984 | 3253.34 | 3289 | 3278 | 762.8 |
| C | 0 | 10 | 677905 | 884.39 | 3289 | 3278 | 762.8 |
| D | 13 | 249 | 6205345 | 8117.72 | 3203 | 3116 | 764.0 |
| D | 12 | 227 | 5090916 | 6659.11 | 3203 | 3116 | 764.0 |
| D | 2 | 249 | 2284296 | 2985.7 | 3203 | 3116 | 764.0 |
Histogram calculated using DETX and DETY for each event in the final _common_clean file
| Quadrant A |  |
 |
Quadrant B |
|---|---|---|---|
| Quadrant D | 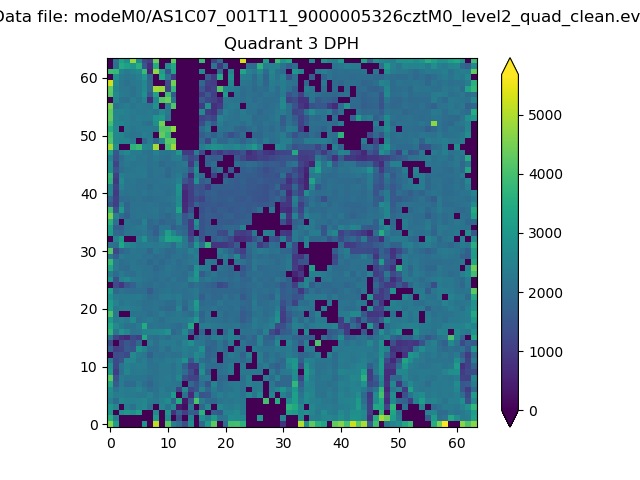 |
 |
Quadrant C |
| Plot type | Count rate plots | Images |
|---|---|---|
| Comparison with Poisson distribution Blue bars denote a histogram of data divided into 1 sec bins. Red curve is a Poisson curve with rate = median count rate of data. |
 |
 |
| Quadrant-wise count rates Data is divided into 100 sec bins |
 |
|
| Module-wise count rates for Quadrant A Data is divided into 100 sec bins |
 |
 |
| Module-wise count rates for Quadrant B Data is divided into 100 sec bins |
 |
 |
| Module-wise count rates for Quadrant C Data is divided into 100 sec bins |
 |
 |
| Module-wise count rates for Quadrant D Data is divided into 100 sec bins |
 |
 |
| Parameter | Plot |
|---|---|
| CZT HV Monitor |  |
| D_VDD |  |
| Temperature 1 | 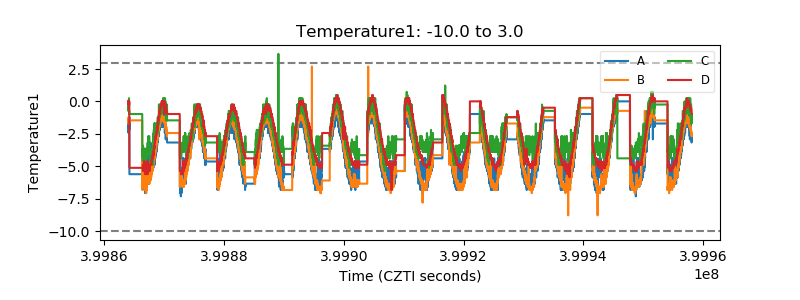 |
| Veto HV Monitor |  |
| Veto LLD |  |
| Alpha Counter |  |
| _CPM_Rate |  |
| CZT Counter |  |
| +2.5 Volts monitor |  |
| +5 Volts monitor |  |
| _ROLL_ROT |  |
| _Roll_DEC |  |
| _Roll_RA |  |
| Veto Counter |  |