| Param | Original file | Final file |
|---|---|---|
| Filename | modeM0/AS1A11_027T01_9000005324cztM0_level2_bc.evt | modeM0/AS1A11_027T01_9000005324cztM0_level2_quad_clean.evt |
| Size (bytes) | 4,378,461,120 | 1,712,733,120 |
| Size | 4.1 GB | 1.6 GB |
| Events in quadrant A | 35,088,018 | 11,400,886 |
| Events in quadrant B | 24,244,421 | 11,736,077 |
| Events in quadrant C | 27,525,326 | 11,657,001 |
| Events in quadrant D | 39,511,079 | 10,799,545 |
| Mode SS | |||
|---|---|---|---|
| Quadrant | BADHDUFLAG | Total packets | Discarded packets |
| A | 0 | 1876 | 0 |
| B | 0 | 1876 | 0 |
| C | 0 | 1876 | 0 |
| D | 0 | 1876 | 0 |
| Mode M9 | |||
|---|---|---|---|
| Quadrant | BADHDUFLAG | Total packets | Discarded packets |
| A | 0 | 359 | 0 |
| B | 0 | 359 | 0 |
| C | 0 | 359 | 0 |
| D | 0 | 359 | 0 |
| Mode M0 | |||
|---|---|---|---|
| Quadrant | BADHDUFLAG | Total packets | Discarded packets |
| A | 0 | 233300 | 0 |
| B | 0 | 205163 | 0 |
| C | 0 | 206684 | 0 |
| D | 0 | 266884 | 0 |
| Quadrant | Total seconds | Saturated seconds | Saturation percentage |
|---|---|---|---|
| A | 91739 | 559 | 0.609337% |
| B | 91739 | 1268 | 1.382182% |
| C | 91739 | 1643 | 1.790950% |
| D | 91739 | 5924 | 6.457450% |
Noise dominated data is calculated using 1-second bins in cleaned event files. If a bin has >2000 counts, and if more than 50% of those come from <1% of pixels, then it is considered to be noise-dominated and hence unusable.
| Quadrant | # 1 sec bins | Bins with >0 counts | Bins with >2000 counts | High rate bins dominated by noise | Noise dominated (total time) | Noise dominated (detector-on time) | Marked lightcurve |
|---|---|---|---|---|---|---|---|
| A | 126453 | 91759 | 57 | 57 | 0.05% | 0.06% |  |
| B | 126452 | 91738 | 161 | 161 | 0.13% | 0.18% |  |
| C | 126452 | 91742 | 342 | 342 | 0.27% | 0.37% |  |
| D | 126452 | 91728 | 439 | 439 | 0.35% | 0.48% | 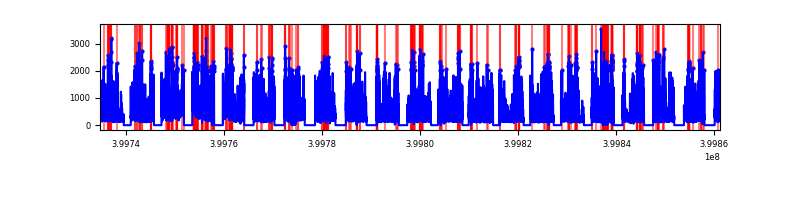 |
Top three noisy pixels from each quadrant. If the there are fewer than three noisy pixels in the level2.evt file, extra rows are filled as -1
| Pixel properties | Quadrant properties | ||||||
|---|---|---|---|---|---|---|---|
| Quadrant | DetID | PixID | Counts | Sigma | Mean | Median | Sigma |
| A | 15 | 222 | 10469642 | 10260.25 | 4602 | 4535 | 1020.0 |
| A | 10 | 83 | 3936102 | 3854.6 | 4602 | 4535 | 1020.0 |
| A | 13 | 248 | 963241 | 939.94 | 4602 | 4535 | 1020.0 |
| B | 5 | 172 | 1568945 | 1685.0 | 4681 | 4586 | 928.4 |
| B | 4 | 171 | 731225 | 782.68 | 4681 | 4586 | 928.4 |
| B | 0 | 213 | 588472 | 628.91 | 4681 | 4586 | 928.4 |
| C | 15 | 214 | 3654901 | 3460.05 | 4594 | 4580 | 1055.0 |
| C | 14 | 254 | 2995170 | 2834.71 | 4594 | 4580 | 1055.0 |
| C | 0 | 10 | 1440594 | 1361.16 | 4594 | 4580 | 1055.0 |
| D | 13 | 249 | 9139979 | 8536.74 | 4475 | 4350 | 1070.2 |
| D | 12 | 235 | 3764008 | 3513.19 | 4475 | 4350 | 1070.2 |
| D | 12 | 227 | 2829556 | 2640.0 | 4475 | 4350 | 1070.2 |
Histogram calculated using DETX and DETY for each event in the final _common_clean file
| Quadrant A |  |
 |
Quadrant B |
|---|---|---|---|
| Quadrant D |  |
 |
Quadrant C |
| Plot type | Count rate plots | Images |
|---|---|---|
| Comparison with Poisson distribution Blue bars denote a histogram of data divided into 1 sec bins. Red curve is a Poisson curve with rate = median count rate of data. |
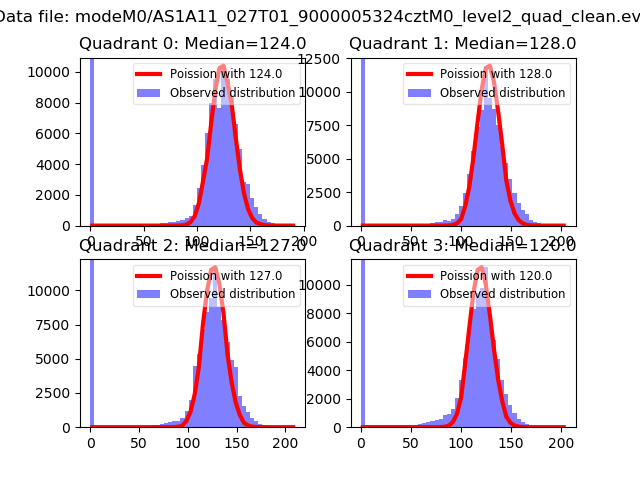 |
 |
| Quadrant-wise count rates Data is divided into 100 sec bins |
 |
|
| Module-wise count rates for Quadrant A Data is divided into 100 sec bins |
 |
 |
| Module-wise count rates for Quadrant B Data is divided into 100 sec bins |
 |
 |
| Module-wise count rates for Quadrant C Data is divided into 100 sec bins |
 |
 |
| Module-wise count rates for Quadrant D Data is divided into 100 sec bins |
 |
 |
| Parameter | Plot |
|---|---|
| CZT HV Monitor |  |
| D_VDD |  |
| Temperature 1 |  |
| Veto HV Monitor |  |
| Veto LLD |  |
| Alpha Counter |  |
| _CPM_Rate |  |
| CZT Counter |  |
| +2.5 Volts monitor |  |
| +5 Volts monitor |  |
| _ROLL_ROT |  |
| _Roll_DEC |  |
| _Roll_RA |  |
| Veto Counter |  |