Observation information
- date-obs: 2022-08-28
- time-obs: 20:03:03.575000000
- date-end: 2022-09-01
- time-end: 12:55:00.275200000
- obs_id: A09_002T01_9000005322
- exposure: 168514.266238
- sourceid: HD 110432
- observer: tsujimot
- ra_pnt: 190.7094
- dec_pnt: -63.05862
Basic statistics of files
| Param |
Original file |
Final file |
|---|
| Filename | modeM0/AS1A09_002T01_9000005322cztM0_level2_bc.evt
| modeM0/AS1A09_002T01_9000005322cztM0_level2_quad_clean.evt
|
| Size (bytes) | 11,787,773,760 | 3,374,556,480 |
| Size | 11.0 GB
| 3.1 GB
|
| Events in quadrant A | 75,467,870 | 21,902,625 |
| Events in quadrant B | 73,320,061 | 21,917,954 |
| Events in quadrant C | 74,470,521 | 22,136,443 |
| Events in quadrant D | 118,322,595 | 20,700,434 |
Level1 data integrity
| Mode M0 |
|---|
| Quadrant | BADHDUFLAG | Total packets | Discarded packets |
|---|
| A | 0 | 536739 | 0 |
| B | 0 | 564988 | 0 |
| C | 0 | 547392 | 0 |
| D | 0 | 693485 | 0 |
| Mode M9 |
|---|
| Quadrant | BADHDUFLAG | Total packets | Discarded packets |
|---|
| A | 0 | 878 | 0 |
| B | 0 | 877 | 0 |
| C | 0 | 878 | 0 |
| D | 0 | 878 | 0 |
| Mode SS |
|---|
| Quadrant | BADHDUFLAG | Total packets | Discarded packets |
|---|
| A | 0 | 4658 | 0 |
| B | 0 | 4661 | 0 |
| C | 0 | 4652 | 0 |
| D | 0 | 4658 | 0 |
Data saturation
| Quadrant | Total seconds | Saturated seconds | Saturation percentage |
|---|
| A | 227086 | 5144 | 2.265221% |
| B | 227065 | 9833 | 4.330478% |
| C | 227190 | 8418 | 3.705269% |
| D | 226832 | 13796 | 6.082034% |
Noise dominated fraction
Noise dominated data is calculated using 1-second bins in cleaned event files. If a bin has >2000 counts, and if more than 50% of those come from <1% of pixels, then it is considered to be noise-dominated and hence unusable.
| Quadrant |
# 1 sec bins |
Bins with >0 counts |
Bins with >2000 counts |
High rate bins dominated by noise |
Noise dominated (total time) |
Noise dominated (detector-on time) |
Marked lightcurve |
|---|
| A | 319918 | 227706 | 1605 | 1605 | 0.50% | 0.70% |  |
|---|
| B | 319918 | 227590 | 1746 | 1746 | 0.55% | 0.77% |  |
|---|
| C | 319918 | 227664 | 1289 | 1289 | 0.40% | 0.57% |  |
|---|
| D | 319918 | 227400 | 5809 | 5809 | 1.82% | 2.55% |  |
|---|
Top noisy pixels
Top three noisy pixels from each quadrant. If the there are fewer than three noisy pixels in the level2.evt file, extra rows are filled as -1
| Pixel properties |
Quadrant properties |
|---|
| Quadrant |
DetID |
PixID |
Counts |
Sigma |
Mean |
Median |
Sigma |
|---|
| A | 15 | 222 | 14814958 | 5750.8 | 11675 | 11548 | 2574.1 |
|---|
| A | 10 | 83 | 9478792 | 3677.81 | 11675 | 11548 | 2574.1 |
|---|
| A | 6 | 10 | 1616421 | 623.46 | 11675 | 11548 | 2574.1 |
|---|
| B | 15 | 35 | 9521947 | 4172.32 | 11637 | 11425 | 2279.4 |
|---|
| B | 4 | 171 | 4633749 | 2027.84 | 11637 | 11425 | 2279.4 |
|---|
| B | 5 | 172 | 3801605 | 1662.77 | 11637 | 11425 | 2279.4 |
|---|
| C | 14 | 254 | 10335440 | 3926.22 | 11460 | 11420 | 2629.5 |
|---|
| C | 15 | 214 | 9100446 | 3456.55 | 11460 | 11420 | 2629.5 |
|---|
| C | 1 | 23 | 5483002 | 2080.84 | 11460 | 11420 | 2629.5 |
|---|
| D | 12 | 227 | 35427525 | 12800.7 | 11477 | 11156 | 2766.8 |
|---|
| D | 13 | 249 | 6339277 | 2287.2 | 11477 | 11156 | 2766.8 |
|---|
| D | 12 | 235 | 6119326 | 2207.7 | 11477 | 11156 | 2766.8 |
|---|
Detector plane histogram (DPH)
Histogram calculated using DETX and DETY for each event in the final _common_clean file
| Quadrant A |
 |
 |
Quadrant B |
|---|
| Quadrant D |
 |
 |
Quadrant C |
|---|
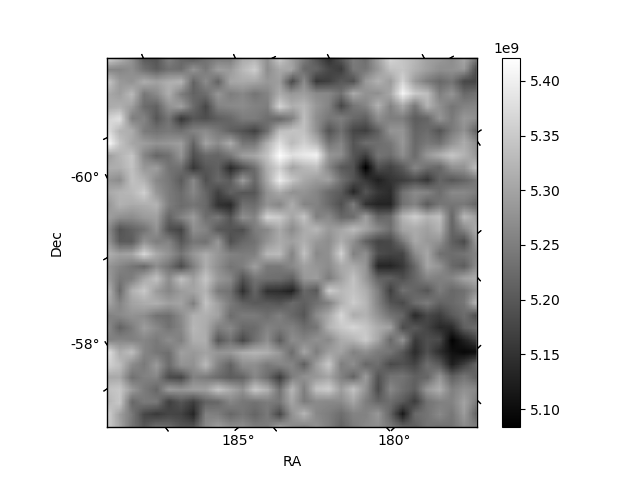
Count rate plots and images
| Plot type |
Count rate plots |
Images |
Comparison with Poisson distribution
Blue bars denote a histogram of data divided into 1 sec bins.
Red curve is a Poisson curve with rate = median count rate of data. |
 |
 |
Quadrant-wise count rates
Data is divided into 100 sec bins |
 |
 |
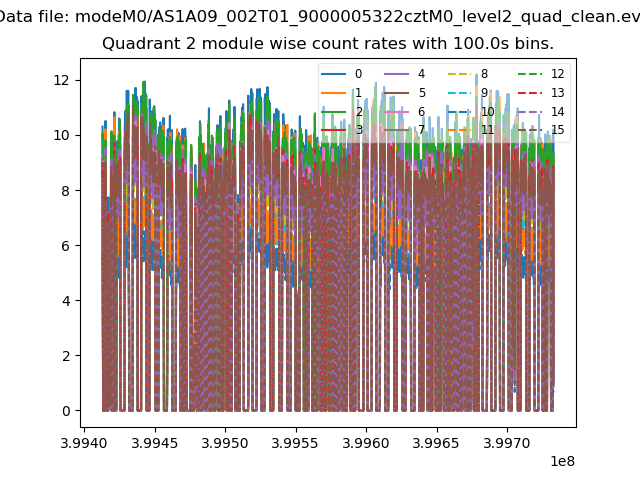
Module-wise count rates for Quadrant A
Data is divided into 100 sec bins |
 |
 |
Module-wise count rates for Quadrant B
Data is divided into 100 sec bins |
 |
 |
Module-wise count rates for Quadrant C
Data is divided into 100 sec bins |
 |
 |
Module-wise count rates for Quadrant D
Data is divided into 100 sec bins |
 |
 |
Housekeeping plots
| Parameter |
Plot |
| CZT HV Monitor |  |
|---|
| D_VDD |  |
|---|
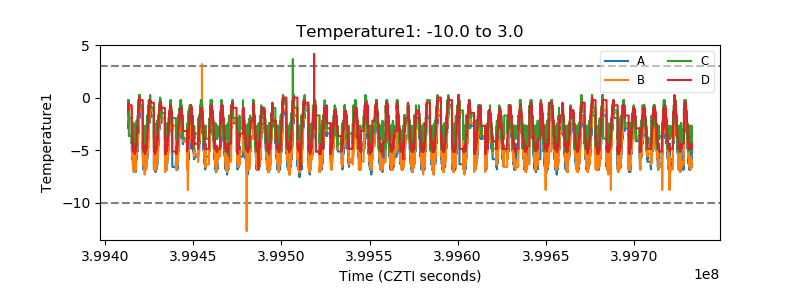
| Temperature 1 |  |
|---|
| Veto HV Monitor |  |
|---|
| Veto LLD |  |
|---|
| Alpha Counter |  |
|---|
| _CPM_Rate |  |
|---|
| CZT Counter |  |
|---|
| +2.5 Volts monitor |  |
|---|
| +5 Volts monitor |  |
|---|
| _ROLL_ROT |  |
|---|
| _Roll_DEC |  |
|---|
| _Roll_RA |  |
|---|
| Veto Counter |  |
|---|


