| Param | Original file | Final file |
|---|---|---|
| Filename | modeM0/AS1C07_001T01_9000005320cztM0_level2_bc.evt | modeM0/AS1C07_001T01_9000005320cztM0_level2_quad_clean.evt |
| Size (bytes) | 4,677,482,880 | 1,396,077,120 |
| Size | 4.4 GB | 1.3 GB |
| Events in quadrant A | 20,324,147 | 9,630,576 |
| Events in quadrant B | 20,184,339 | 9,677,820 |
| Events in quadrant C | 23,633,339 | 9,505,005 |
| Events in quadrant D | 72,233,026 | 8,134,200 |
| Mode SS | |||
|---|---|---|---|
| Quadrant | BADHDUFLAG | Total packets | Discarded packets |
| A | 0 | 1592 | 0 |
| B | 0 | 1592 | 0 |
| C | 0 | 1592 | 0 |
| D | 0 | 1592 | 0 |
| Mode M0 | |||
|---|---|---|---|
| Quadrant | BADHDUFLAG | Total packets | Discarded packets |
| A | 0 | 165918 | 0 |
| B | 0 | 172351 | 0 |
| C | 0 | 175936 | 0 |
| D | 0 | 364662 | 0 |
| Mode M9 | |||
|---|---|---|---|
| Quadrant | BADHDUFLAG | Total packets | Discarded packets |
| A | 0 | 280 | 0 |
| B | 0 | 280 | 0 |
| C | 0 | 280 | 0 |
| D | 0 | 280 | 0 |
| Quadrant | Total seconds | Saturated seconds | Saturation percentage |
|---|---|---|---|
| A | 77814 | 254 | 0.326419% |
| B | 77812 | 856 | 1.100087% |
| C | 77814 | 1089 | 1.399491% |
| D | 77814 | 18574 | 23.869741% |
Noise dominated data is calculated using 1-second bins in cleaned event files. If a bin has >2000 counts, and if more than 50% of those come from <1% of pixels, then it is considered to be noise-dominated and hence unusable.
| Quadrant | # 1 sec bins | Bins with >0 counts | Bins with >2000 counts | High rate bins dominated by noise | Noise dominated (total time) | Noise dominated (detector-on time) | Marked lightcurve |
|---|---|---|---|---|---|---|---|
| A | 105992 | 77832 | 46 | 46 | 0.04% | 0.06% |  |
| B | 105992 | 77816 | 80 | 80 | 0.08% | 0.10% |  |
| C | 105992 | 77816 | 379 | 379 | 0.36% | 0.49% | 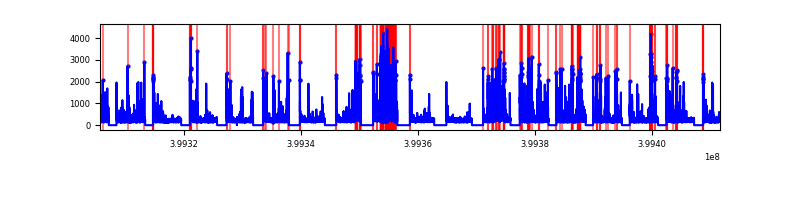 |
| D | 105992 | 77810 | 3071 | 3071 | 2.90% | 3.95% |  |
Top three noisy pixels from each quadrant. If the there are fewer than three noisy pixels in the level2.evt file, extra rows are filled as -1
| Pixel properties | Quadrant properties | ||||||
|---|---|---|---|---|---|---|---|
| Quadrant | DetID | PixID | Counts | Sigma | Mean | Median | Sigma |
| A | 10 | 83 | 3330524 | 3843.89 | 3863 | 3812 | 865.5 |
| A | 9 | 143 | 370188 | 423.33 | 3863 | 3812 | 865.5 |
| A | 6 | 10 | 343393 | 392.37 | 3863 | 3812 | 865.5 |
| B | 5 | 172 | 1022929 | 1321.14 | 3867 | 3786 | 771.4 |
| B | 0 | 190 | 600219 | 773.17 | 3867 | 3786 | 771.4 |
| B | 0 | 213 | 561648 | 723.17 | 3867 | 3786 | 771.4 |
| C | 1 | 23 | 3697078 | 4273.62 | 3742 | 3717 | 864.2 |
| C | 15 | 214 | 3102819 | 3586.0 | 3742 | 3717 | 864.2 |
| C | 14 | 254 | 889467 | 1024.91 | 3742 | 3717 | 864.2 |
| D | 12 | 235 | 40578382 | 47879.72 | 3445 | 3337 | 847.4 |
| D | 12 | 227 | 5970612 | 7041.56 | 3445 | 3337 | 847.4 |
| D | 1 | 47 | 3198066 | 3769.87 | 3445 | 3337 | 847.4 |
Histogram calculated using DETX and DETY for each event in the final _common_clean file
| Quadrant A |  |
 |
Quadrant B |
|---|---|---|---|
| Quadrant D | 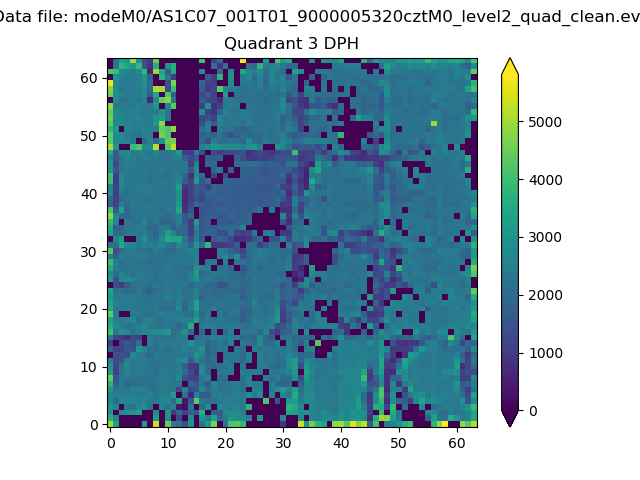 |
 |
Quadrant C |
| Plot type | Count rate plots | Images |
|---|---|---|
| Comparison with Poisson distribution Blue bars denote a histogram of data divided into 1 sec bins. Red curve is a Poisson curve with rate = median count rate of data. |
 |
 |
| Quadrant-wise count rates Data is divided into 100 sec bins |
 |
|
| Module-wise count rates for Quadrant A Data is divided into 100 sec bins |
 |
 |
| Module-wise count rates for Quadrant B Data is divided into 100 sec bins |
 |
 |
| Module-wise count rates for Quadrant C Data is divided into 100 sec bins |
 |
 |
| Module-wise count rates for Quadrant D Data is divided into 100 sec bins |
 |
 |
| Parameter | Plot |
|---|---|
| CZT HV Monitor |  |
| D_VDD |  |
| Temperature 1 |  |
| Veto HV Monitor | 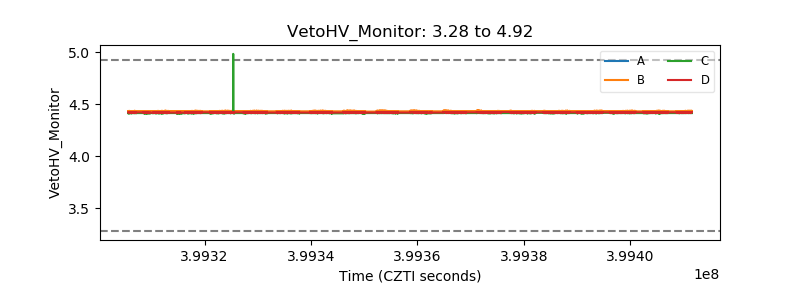 |
| Veto LLD |  |
| Alpha Counter |  |
| _CPM_Rate | 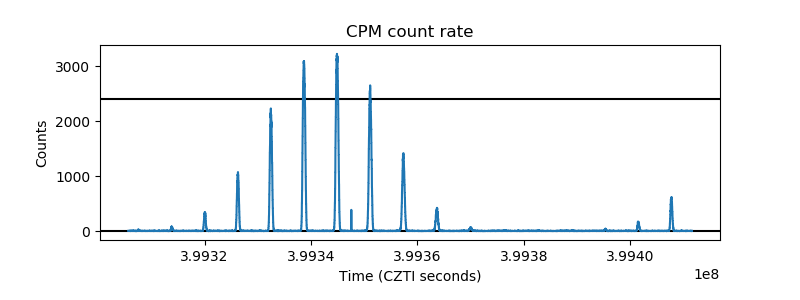 |
| CZT Counter |  |
| +2.5 Volts monitor |  |
| +5 Volts monitor |  |
| _ROLL_ROT |  |
| _Roll_DEC | 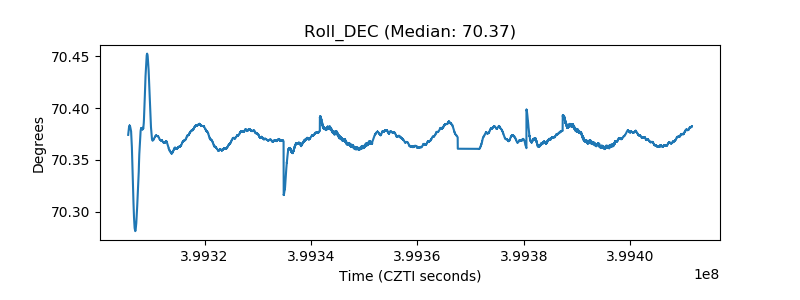 |
| _Roll_RA |  |
| Veto Counter |  |