| Param | Original file | Final file |
|---|---|---|
| Filename | modeM0/AS1T05_048T01_9000005318cztM0_level2_bc.evt | modeM0/AS1T05_048T01_9000005318cztM0_level2_quad_clean.evt |
| Size (bytes) | 5,135,330,880 | 1,005,753,600 |
| Size | 4.8 GB | 959.2 MB |
| Events in quadrant A | 20,146,092 | 6,529,150 |
| Events in quadrant B | 24,103,300 | 6,573,259 |
| Events in quadrant C | 22,868,747 | 6,640,421 |
| Events in quadrant D | 82,968,125 | 5,217,858 |
| Mode M0 | |||
|---|---|---|---|
| Quadrant | BADHDUFLAG | Total packets | Discarded packets |
| A | 0 | 168954 | 0 |
| B | 0 | 191195 | 0 |
| C | 0 | 175798 | 0 |
| D | 0 | 400647 | 0 |
| Mode SS | |||
|---|---|---|---|
| Quadrant | BADHDUFLAG | Total packets | Discarded packets |
| A | 0 | 1640 | 0 |
| B | 0 | 1640 | 0 |
| C | 0 | 1640 | 0 |
| D | 0 | 1640 | 0 |
| Mode M9 | |||
|---|---|---|---|
| Quadrant | BADHDUFLAG | Total packets | Discarded packets |
| A | 0 | 293 | 0 |
| B | 0 | 293 | 0 |
| C | 0 | 293 | 0 |
| D | 0 | 294 | 0 |
| Quadrant | Total seconds | Saturated seconds | Saturation percentage |
|---|---|---|---|
| A | 80122 | 202 | 0.252116% |
| B | 80124 | 2553 | 3.186311% |
| C | 80121 | 841 | 1.049662% |
| D | 80125 | 21284 | 26.563495% |
Noise dominated data is calculated using 1-second bins in cleaned event files. If a bin has >2000 counts, and if more than 50% of those come from <1% of pixels, then it is considered to be noise-dominated and hence unusable.
| Quadrant | # 1 sec bins | Bins with >0 counts | Bins with >2000 counts | High rate bins dominated by noise | Noise dominated (total time) | Noise dominated (detector-on time) | Marked lightcurve |
|---|---|---|---|---|---|---|---|
| A | 108897 | 80143 | 22 | 22 | 0.02% | 0.03% |  |
| B | 108896 | 80124 | 272 | 272 | 0.25% | 0.34% |  |
| C | 108896 | 80127 | 300 | 300 | 0.28% | 0.37% |  |
| D | 108896 | 80127 | 5674 | 5674 | 5.21% | 7.08% |  |
Top three noisy pixels from each quadrant. If the there are fewer than three noisy pixels in the level2.evt file, extra rows are filled as -1
| Pixel properties | Quadrant properties | ||||||
|---|---|---|---|---|---|---|---|
| Quadrant | DetID | PixID | Counts | Sigma | Mean | Median | Sigma |
| A | 10 | 83 | 3379042 | 3723.19 | 4062 | 3995 | 906.5 |
| A | 13 | 248 | 353135 | 385.15 | 4062 | 3995 | 906.5 |
| A | 9 | 143 | 194108 | 209.72 | 4062 | 3995 | 906.5 |
| B | 5 | 255 | 3054281 | 3789.71 | 4082 | 3987 | 804.9 |
| B | 5 | 172 | 2083873 | 2584.07 | 4082 | 3987 | 804.9 |
| B | 4 | 171 | 654085 | 807.69 | 4082 | 3987 | 804.9 |
| C | 15 | 214 | 3190760 | 3434.3 | 4030 | 4005 | 927.9 |
| C | 1 | 23 | 1844740 | 1983.72 | 4030 | 4005 | 927.9 |
| C | 0 | 10 | 652720 | 699.11 | 4030 | 4005 | 927.9 |
| D | 12 | 235 | 52299196 | 60068.85 | 3640 | 3530 | 870.6 |
| D | 12 | 227 | 6159392 | 7070.86 | 3640 | 3530 | 870.6 |
| D | 2 | 249 | 3153408 | 3618.07 | 3640 | 3530 | 870.6 |
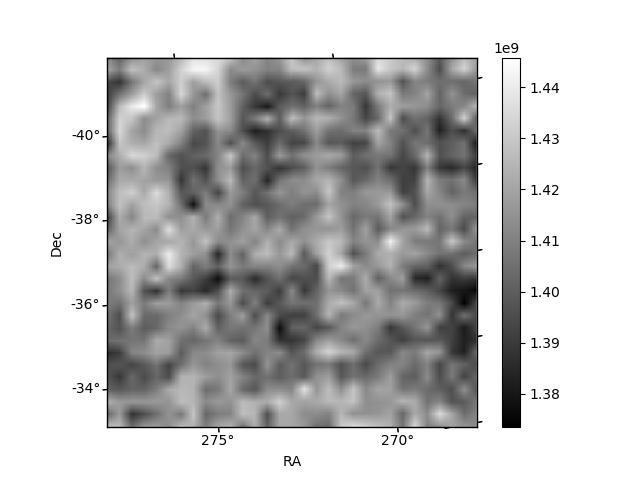
Histogram calculated using DETX and DETY for each event in the final _common_clean file
| Quadrant A |  |
 |
Quadrant B |
|---|---|---|---|
| Quadrant D |  |
 |
Quadrant C |
| Plot type | Count rate plots | Images |
|---|---|---|
| Comparison with Poisson distribution Blue bars denote a histogram of data divided into 1 sec bins. Red curve is a Poisson curve with rate = median count rate of data. |
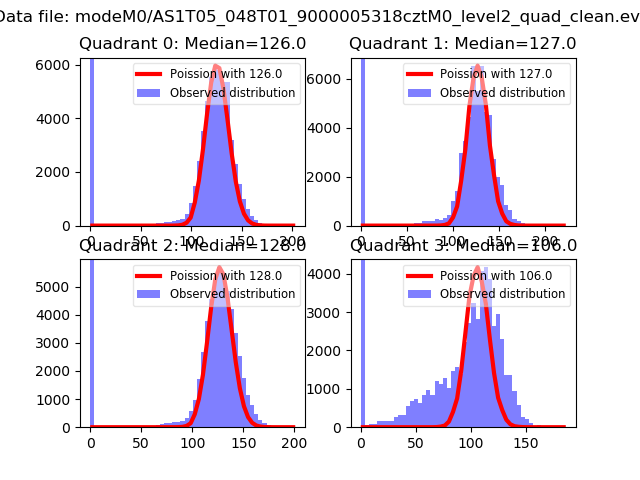 |
 |
| Quadrant-wise count rates Data is divided into 100 sec bins |
 |
|
| Module-wise count rates for Quadrant A Data is divided into 100 sec bins |
 |
 |
| Module-wise count rates for Quadrant B Data is divided into 100 sec bins |
 |
 |
| Module-wise count rates for Quadrant C Data is divided into 100 sec bins |
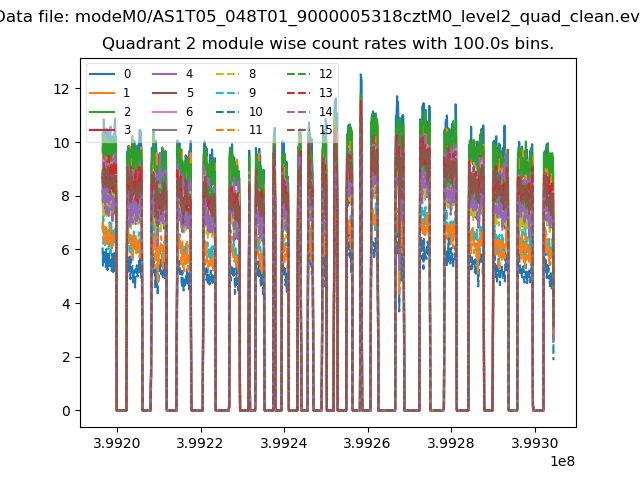 |
 |
| Module-wise count rates for Quadrant D Data is divided into 100 sec bins |
 |
 |
| Parameter | Plot |
|---|---|
| CZT HV Monitor |  |
| D_VDD |  |
| Temperature 1 |  |
| Veto HV Monitor |  |
| Veto LLD |  |
| Alpha Counter |  |
| _CPM_Rate |  |
| CZT Counter |  |
| +2.5 Volts monitor |  |
| +5 Volts monitor |  |
| _ROLL_ROT |  |
| _Roll_DEC |  |
| _Roll_RA |  |
| Veto Counter |  |