| Param | Original file | Final file |
|---|---|---|
| Filename | modeM0/AS1A10_094T20_9000005316cztM0_level2_bc.evt | modeM0/AS1A10_094T20_9000005316cztM0_level2_quad_clean.evt |
| Size (bytes) | 1,388,059,200 | 371,079,360 |
| Size | 1.3 GB | 353.9 MB |
| Events in quadrant A | 5,088,295 | 2,583,518 |
| Events in quadrant B | 7,155,979 | 2,575,830 |
| Events in quadrant C | 6,719,101 | 2,683,206 |
| Events in quadrant D | 21,761,754 | 2,068,433 |
| Mode SS | |||
|---|---|---|---|
| Quadrant | BADHDUFLAG | Total packets | Discarded packets |
| A | 0 | 390 | 0 |
| B | 0 | 390 | 0 |
| C | 0 | 390 | 0 |
| D | 0 | 390 | 0 |
| Mode M0 | |||
|---|---|---|---|
| Quadrant | BADHDUFLAG | Total packets | Discarded packets |
| A | 0 | 40928 | 0 |
| B | 0 | 51419 | 0 |
| C | 0 | 45802 | 0 |
| D | 0 | 106568 | 0 |
| Mode M9 | |||
|---|---|---|---|
| Quadrant | BADHDUFLAG | Total packets | Discarded packets |
| A | 0 | 81 | 0 |
| B | 0 | 81 | 0 |
| C | 0 | 81 | 0 |
| D | 0 | 81 | 0 |
| Quadrant | Total seconds | Saturated seconds | Saturation percentage |
|---|---|---|---|
| A | 19263 | 59 | 0.306287% |
| B | 19261 | 1151 | 5.975806% |
| C | 19263 | 315 | 1.635259% |
| D | 19263 | 7031 | 36.500026% |
Noise dominated data is calculated using 1-second bins in cleaned event files. If a bin has >2000 counts, and if more than 50% of those come from <1% of pixels, then it is considered to be noise-dominated and hence unusable.
| Quadrant | # 1 sec bins | Bins with >0 counts | Bins with >2000 counts | High rate bins dominated by noise | Noise dominated (total time) | Noise dominated (detector-on time) | Marked lightcurve |
|---|---|---|---|---|---|---|---|
| A | 27275 | 19267 | 5 | 5 | 0.02% | 0.03% |  |
| B | 27275 | 19264 | 52 | 52 | 0.19% | 0.27% |  |
| C | 27275 | 19264 | 79 | 79 | 0.29% | 0.41% |  |
| D | 27275 | 19262 | 1157 | 1157 | 4.24% | 6.01% |  |
Top three noisy pixels from each quadrant. If the there are fewer than three noisy pixels in the level2.evt file, extra rows are filled as -1
| Pixel properties | Quadrant properties | ||||||
|---|---|---|---|---|---|---|---|
| Quadrant | DetID | PixID | Counts | Sigma | Mean | Median | Sigma |
| A | 10 | 83 | 781435 | 3400.75 | 1040 | 1025 | 229.5 |
| A | 9 | 143 | 130196 | 562.88 | 1040 | 1025 | 229.5 |
| A | 13 | 248 | 94389 | 406.85 | 1040 | 1025 | 229.5 |
| B | 5 | 255 | 2121369 | 10578.34 | 1031 | 1014 | 200.4 |
| B | 5 | 172 | 265936 | 1321.68 | 1031 | 1014 | 200.4 |
| B | 0 | 190 | 182956 | 907.7 | 1031 | 1014 | 200.4 |
| C | 15 | 208 | 1148415 | 4696.74 | 1057 | 1055 | 244.3 |
| C | 15 | 214 | 764685 | 3125.93 | 1057 | 1055 | 244.3 |
| C | 1 | 23 | 378836 | 1546.45 | 1057 | 1055 | 244.3 |
| D | 12 | 235 | 15912586 | 74311.69 | 891 | 865 | 214.1 |
| D | 12 | 227 | 997358 | 4653.87 | 891 | 865 | 214.1 |
| D | 10 | 253 | 391272 | 1823.3 | 891 | 865 | 214.1 |
Histogram calculated using DETX and DETY for each event in the final _common_clean file
| Quadrant A |  |
 |
Quadrant B |
|---|---|---|---|
| Quadrant D |  |
 |
Quadrant C |
| Plot type | Count rate plots | Images |
|---|---|---|
| Comparison with Poisson distribution Blue bars denote a histogram of data divided into 1 sec bins. Red curve is a Poisson curve with rate = median count rate of data. |
 |
 |
| Quadrant-wise count rates Data is divided into 100 sec bins |
 |
|
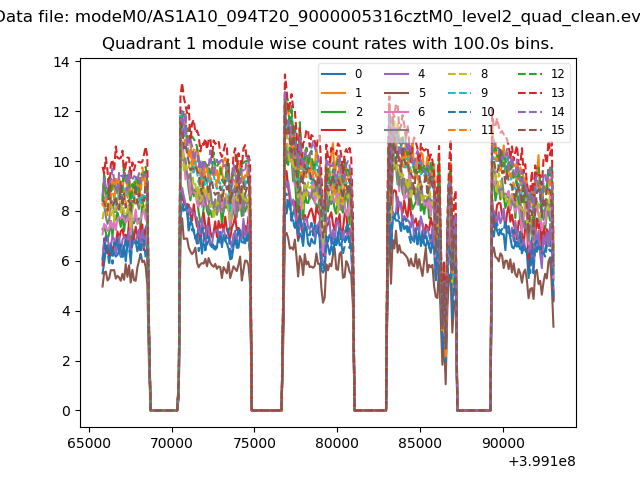
| Module-wise count rates for Quadrant A Data is divided into 100 sec bins |
 |
 |
| Module-wise count rates for Quadrant B Data is divided into 100 sec bins |
 |
 |
| Module-wise count rates for Quadrant C Data is divided into 100 sec bins |
 |
 |
| Module-wise count rates for Quadrant D Data is divided into 100 sec bins |
 |
 |
| Parameter | Plot |
|---|---|
| CZT HV Monitor | 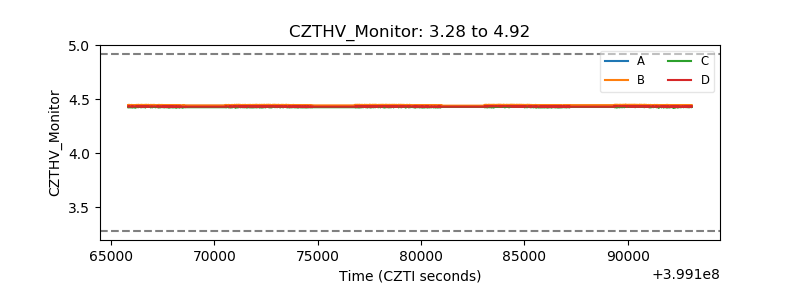 |
| D_VDD |  |
| Temperature 1 |  |
| Veto HV Monitor | 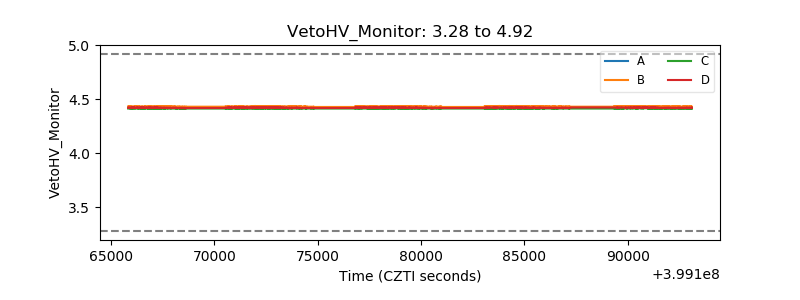 |
| Veto LLD |  |
| Alpha Counter |  |
| _CPM_Rate | 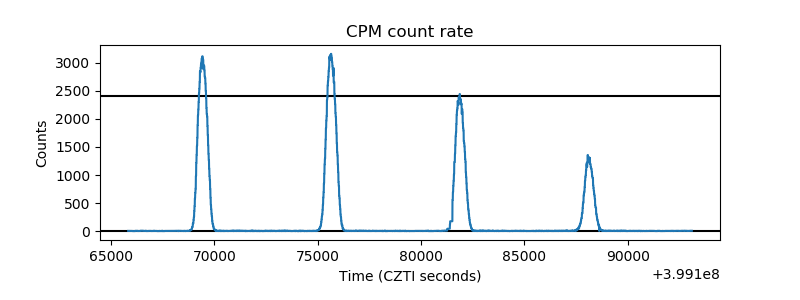 |
| CZT Counter |  |
| +2.5 Volts monitor |  |
| +5 Volts monitor |  |
| _ROLL_ROT |  |
| _Roll_DEC |  |
| _Roll_RA |  |
| Veto Counter | 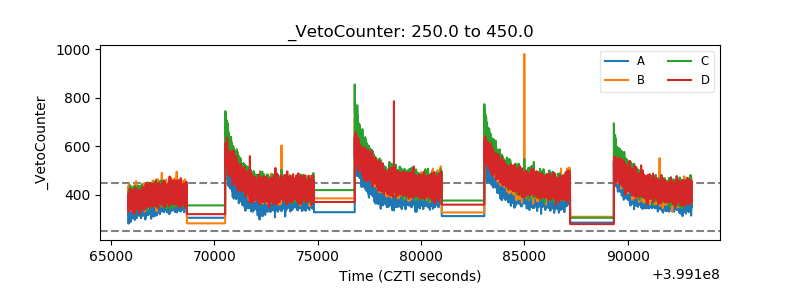 |