| Param | Original file | Final file |
|---|---|---|
| Filename | modeM0/AS1A10_094T15_9000005312cztM0_level2_bc.evt | modeM0/AS1A10_094T15_9000005312cztM0_level2_quad_clean.evt |
| Size (bytes) | 144,328,320 | 62,657,280 |
| Size | 137.6 MB | 59.8 MB |
| Events in quadrant A | 861,472 | 412,234 |
| Events in quadrant B | 739,885 | 418,478 |
| Events in quadrant C | 1,049,147 | 420,640 |
| Events in quadrant D | 1,476,151 | 400,009 |
| Mode M0 | |||
|---|---|---|---|
| Quadrant | BADHDUFLAG | Total packets | Discarded packets |
| A | 0 | 7338 | 0 |
| B | 0 | 7156 | 0 |
| C | 0 | 7776 | 0 |
| D | 0 | 9691 | 0 |
| Mode M9 | |||
|---|---|---|---|
| Quadrant | BADHDUFLAG | Total packets | Discarded packets |
| A | 0 | 14 | 0 |
| B | 0 | 14 | 0 |
| C | 0 | 14 | 0 |
| D | 0 | 14 | 0 |
| Mode SS | |||
|---|---|---|---|
| Quadrant | BADHDUFLAG | Total packets | Discarded packets |
| A | 0 | 70 | 0 |
| B | 0 | 70 | 0 |
| C | 0 | 70 | 0 |
| D | 0 | 70 | 0 |
| Quadrant | Total seconds | Saturated seconds | Saturation percentage |
|---|---|---|---|
| A | 3479 | 14 | 0.402414% |
| B | 3476 | 7 | 0.201381% |
| C | 3476 | 44 | 1.265823% |
| D | 3476 | 130 | 3.739931% |
Noise dominated data is calculated using 1-second bins in cleaned event files. If a bin has >2000 counts, and if more than 50% of those come from <1% of pixels, then it is considered to be noise-dominated and hence unusable.
| Quadrant | # 1 sec bins | Bins with >0 counts | Bins with >2000 counts | High rate bins dominated by noise | Noise dominated (total time) | Noise dominated (detector-on time) | Marked lightcurve |
|---|---|---|---|---|---|---|---|
| A | 4822 | 3480 | 0 | 0 | 0.00% | 0.00% |  |
| B | 4822 | 3478 | 0 | 0 | 0.00% | 0.00% | 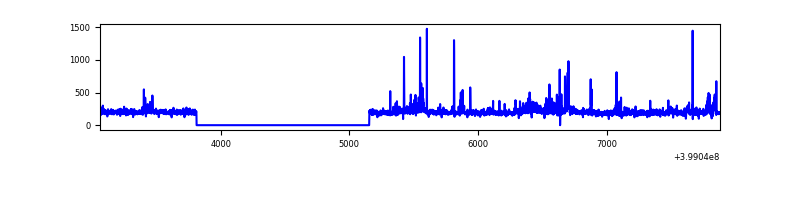 |
| C | 4822 | 3478 | 8 | 8 | 0.17% | 0.23% |  |
| D | 4822 | 3479 | 12 | 12 | 0.25% | 0.34% |  |
Top three noisy pixels from each quadrant. If the there are fewer than three noisy pixels in the level2.evt file, extra rows are filled as -1
| Pixel properties | Quadrant properties | ||||||
|---|---|---|---|---|---|---|---|
| Quadrant | DetID | PixID | Counts | Sigma | Mean | Median | Sigma |
| A | 10 | 83 | 161643 | 4091.54 | 165 | 161 | 39.5 |
| A | 9 | 143 | 23756 | 597.84 | 165 | 161 | 39.5 |
| A | 13 | 6 | 9455 | 235.49 | 165 | 161 | 39.5 |
| B | 0 | 190 | 36223 | 1006.43 | 166 | 162 | 35.8 |
| B | 15 | 85 | 12610 | 347.41 | 166 | 162 | 35.8 |
| B | 5 | 172 | 9637 | 264.44 | 166 | 162 | 35.8 |
| C | 15 | 214 | 139115 | 3377.93 | 164 | 162 | 41.1 |
| C | 14 | 254 | 116029 | 2816.71 | 164 | 162 | 41.1 |
| C | 1 | 23 | 102345 | 2484.06 | 164 | 162 | 41.1 |
| D | 12 | 235 | 351077 | 8466.83 | 164 | 158 | 41.4 |
| D | 2 | 249 | 338142 | 8154.74 | 164 | 158 | 41.4 |
| D | 2 | 153 | 42493 | 1021.44 | 164 | 158 | 41.4 |
Histogram calculated using DETX and DETY for each event in the final _common_clean file
| Quadrant A |  |
 |
Quadrant B |
|---|---|---|---|
| Quadrant D |  |
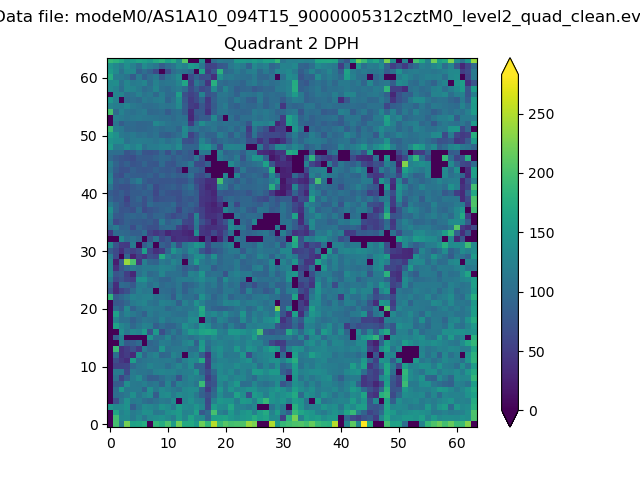 |
Quadrant C |
| Plot type | Count rate plots | Images |
|---|---|---|
| Comparison with Poisson distribution Blue bars denote a histogram of data divided into 1 sec bins. Red curve is a Poisson curve with rate = median count rate of data. |
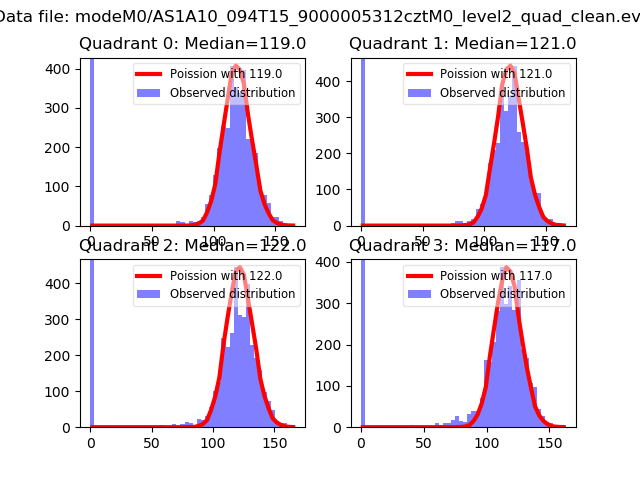 |
 |
| Quadrant-wise count rates Data is divided into 100 sec bins |
 |
|
| Module-wise count rates for Quadrant A Data is divided into 100 sec bins |
 |
 |
| Module-wise count rates for Quadrant B Data is divided into 100 sec bins |
 |
 |
| Module-wise count rates for Quadrant C Data is divided into 100 sec bins |
 |
 |
| Module-wise count rates for Quadrant D Data is divided into 100 sec bins |
 |
 |
| Parameter | Plot |
|---|---|
| CZT HV Monitor |  |
| D_VDD |  |
| Temperature 1 |  |
| Veto HV Monitor | 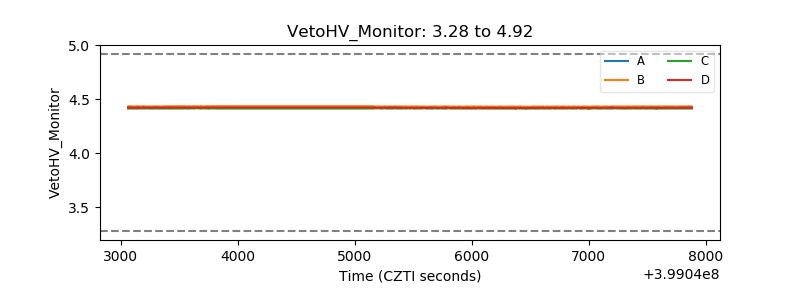 |
| Veto LLD |  |
| Alpha Counter |  |
| _CPM_Rate | 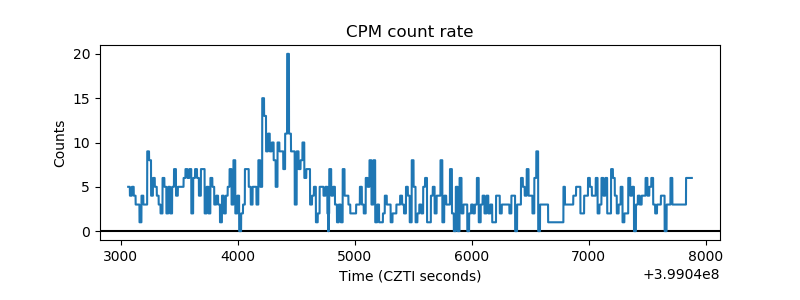 |
| CZT Counter |  |
| +2.5 Volts monitor |  |
| +5 Volts monitor |  |
| _ROLL_ROT | 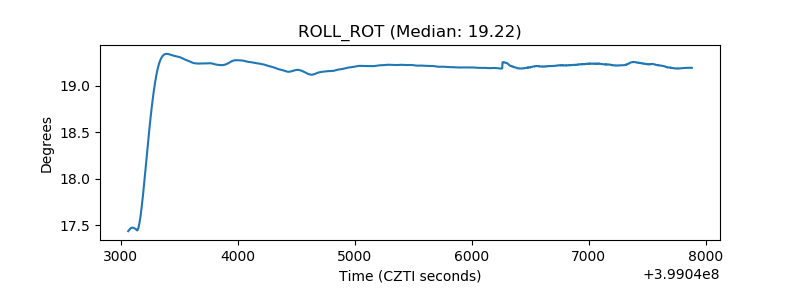 |
| _Roll_DEC |  |
| _Roll_RA |  |
| Veto Counter |  |