| Param | Original file | Final file |
|---|---|---|
| Filename | modeM0/AS1A11_030T02_9000005310cztM0_level2_bc.evt | modeM0/AS1A11_030T02_9000005310cztM0_level2_quad_clean.evt |
| Size (bytes) | 6,432,491,520 | 1,551,153,600 |
| Size | 6.0 GB | 1.4 GB |
| Events in quadrant A | 36,161,999 | 9,849,584 |
| Events in quadrant B | 34,222,120 | 10,018,141 |
| Events in quadrant C | 47,224,946 | 9,686,368 |
| Events in quadrant D | 68,593,972 | 8,746,182 |
| Mode M0 | |||
|---|---|---|---|
| Quadrant | BADHDUFLAG | Total packets | Discarded packets |
| A | 0 | 285301 | 0 |
| B | 0 | 291322 | 0 |
| C | 0 | 319052 | 0 |
| D | 0 | 400276 | 0 |
| Mode SS | |||
|---|---|---|---|
| Quadrant | BADHDUFLAG | Total packets | Discarded packets |
| A | 0 | 2592 | 0 |
| B | 0 | 2592 | 0 |
| C | 0 | 2592 | 0 |
| D | 0 | 2592 | 0 |
| Mode M9 | |||
|---|---|---|---|
| Quadrant | BADHDUFLAG | Total packets | Discarded packets |
| A | 0 | 480 | 0 |
| B | 0 | 480 | 0 |
| C | 0 | 480 | 0 |
| D | 0 | 480 | 0 |
| Quadrant | Total seconds | Saturated seconds | Saturation percentage |
|---|---|---|---|
| A | 126655 | 1719 | 1.357230% |
| B | 126655 | 2977 | 2.350480% |
| C | 126655 | 4614 | 3.642967% |
| D | 126655 | 14677 | 11.588173% |
Noise dominated data is calculated using 1-second bins in cleaned event files. If a bin has >2000 counts, and if more than 50% of those come from <1% of pixels, then it is considered to be noise-dominated and hence unusable.
| Quadrant | # 1 sec bins | Bins with >0 counts | Bins with >2000 counts | High rate bins dominated by noise | Noise dominated (total time) | Noise dominated (detector-on time) | Marked lightcurve |
|---|---|---|---|---|---|---|---|
| A | 174811 | 126600 | 251 | 251 | 0.14% | 0.20% |  |
| B | 174811 | 126655 | 159 | 159 | 0.09% | 0.13% |  |
| C | 174811 | 126658 | 1688 | 1688 | 0.97% | 1.33% | 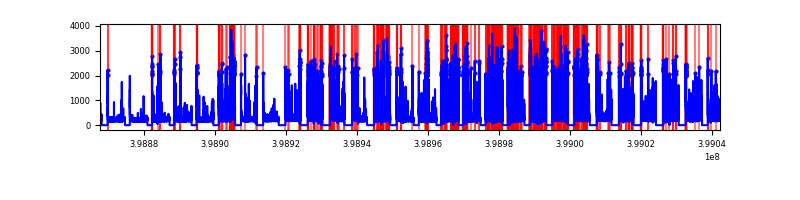 |
| D | 174811 | 126654 | 8590 | 8590 | 4.91% | 6.78% |  |
Top three noisy pixels from each quadrant. If the there are fewer than three noisy pixels in the level2.evt file, extra rows are filled as -1
| Pixel properties | Quadrant properties | ||||||
|---|---|---|---|---|---|---|---|
| Quadrant | DetID | PixID | Counts | Sigma | Mean | Median | Sigma |
| A | 10 | 83 | 5197584 | 3655.48 | 6428 | 6326 | 1420.1 |
| A | 15 | 237 | 2602766 | 1828.31 | 6428 | 6326 | 1420.1 |
| A | 13 | 248 | 1386282 | 971.71 | 6428 | 6326 | 1420.1 |
| B | 5 | 172 | 3797136 | 2998.31 | 6464 | 6320 | 1264.3 |
| B | 0 | 190 | 1366028 | 1075.45 | 6464 | 6320 | 1264.3 |
| B | 0 | 213 | 1142827 | 898.91 | 6464 | 6320 | 1264.3 |
| C | 1 | 23 | 14390428 | 10091.71 | 6246 | 6197 | 1425.4 |
| C | 15 | 214 | 4943878 | 3464.19 | 6246 | 6197 | 1425.4 |
| C | 0 | 10 | 1703515 | 1190.81 | 6246 | 6197 | 1425.4 |
| D | 12 | 227 | 22287802 | 15324.51 | 6054 | 5866 | 1454.0 |
| D | 10 | 253 | 6548882 | 4499.99 | 6054 | 5866 | 1454.0 |
| D | 2 | 249 | 6179976 | 4246.28 | 6054 | 5866 | 1454.0 |
Histogram calculated using DETX and DETY for each event in the final _common_clean file
| Quadrant A |  |
 |
Quadrant B |
|---|---|---|---|
| Quadrant D |  |
 |
Quadrant C |
| Plot type | Count rate plots | Images |
|---|---|---|
| Comparison with Poisson distribution Blue bars denote a histogram of data divided into 1 sec bins. Red curve is a Poisson curve with rate = median count rate of data. |
 |
 |
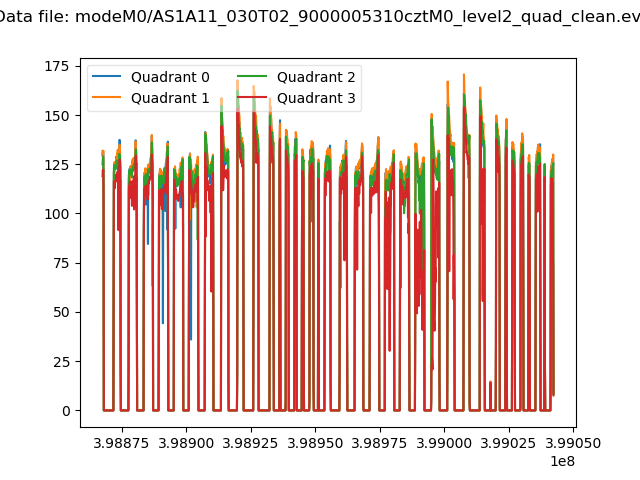
| Quadrant-wise count rates Data is divided into 100 sec bins |
 |
|
| Module-wise count rates for Quadrant A Data is divided into 100 sec bins |
 |
 |
| Module-wise count rates for Quadrant B Data is divided into 100 sec bins |
 |
 |
| Module-wise count rates for Quadrant C Data is divided into 100 sec bins |
 |
 |
| Module-wise count rates for Quadrant D Data is divided into 100 sec bins |
 |
 |
| Parameter | Plot |
|---|---|
| CZT HV Monitor | 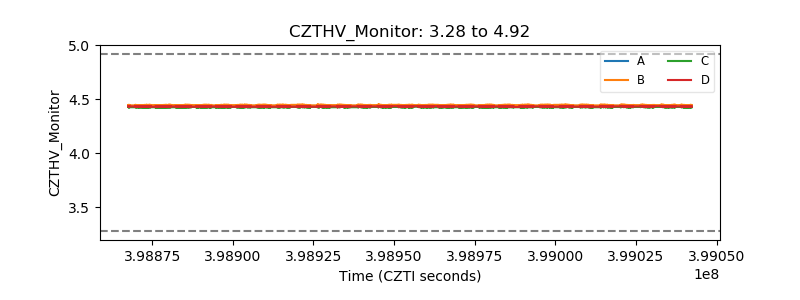 |
| D_VDD | 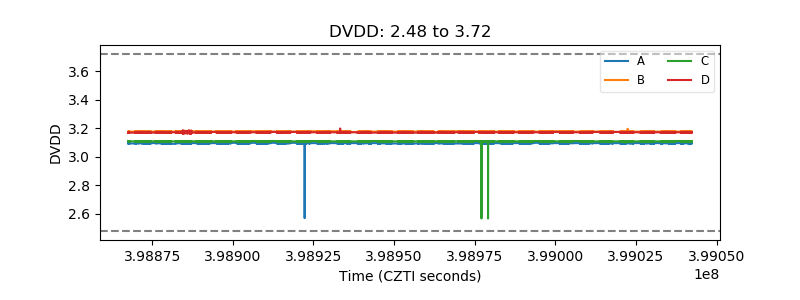 |
| Temperature 1 |  |
| Veto HV Monitor | 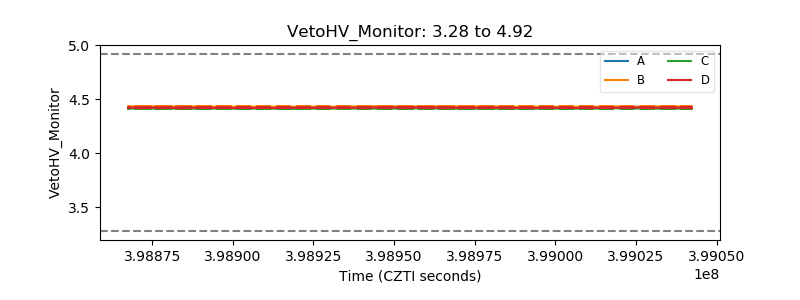 |
| Veto LLD |  |
| Alpha Counter |  |
| _CPM_Rate |  |
| CZT Counter |  |
| +2.5 Volts monitor | 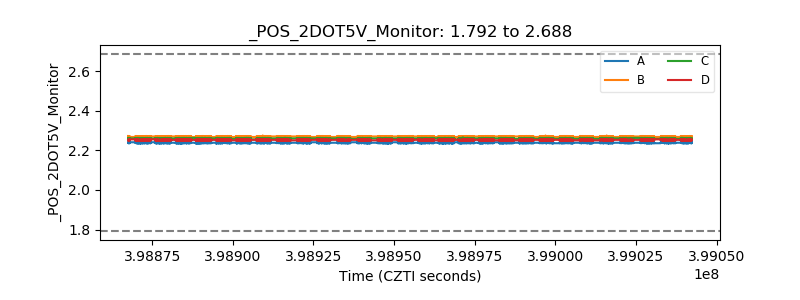 |
| +5 Volts monitor | 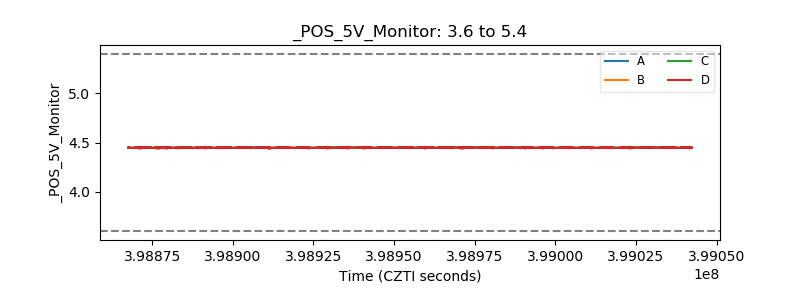 |
| _ROLL_ROT |  |
| _Roll_DEC |  |
| _Roll_RA |  |
| Veto Counter |  |