| Param | Original file | Final file |
|---|---|---|
| Filename | modeM0/AS1A10_094T23_9000005304cztM0_level2_bc.evt | modeM0/AS1A10_094T23_9000005304cztM0_level2_quad_clean.evt |
| Size (bytes) | 352,437,120 | 165,769,920 |
| Size | 336.1 MB | 158.1 MB |
| Events in quadrant A | 2,178,079 | 1,110,212 |
| Events in quadrant B | 2,335,991 | 1,113,372 |
| Events in quadrant C | 2,275,826 | 1,150,736 |
| Events in quadrant D | 3,315,972 | 1,074,763 |
| Mode SS | |||
|---|---|---|---|
| Quadrant | BADHDUFLAG | Total packets | Discarded packets |
| A | 0 | 168 | 0 |
| B | 0 | 168 | 0 |
| C | 0 | 168 | 0 |
| D | 0 | 168 | 0 |
| Mode M0 | |||
|---|---|---|---|
| Quadrant | BADHDUFLAG | Total packets | Discarded packets |
| A | 0 | 17307 | 0 |
| B | 0 | 19091 | 0 |
| C | 0 | 17343 | 0 |
| D | 0 | 22154 | 0 |
| Mode M9 | |||
|---|---|---|---|
| Quadrant | BADHDUFLAG | Total packets | Discarded packets |
| A | 0 | 35 | 0 |
| B | 0 | 35 | 0 |
| C | 0 | 35 | 0 |
| D | 0 | 35 | 0 |
| Quadrant | Total seconds | Saturated seconds | Saturation percentage |
|---|---|---|---|
| A | 8229 | 13 | 0.157978% |
| B | 8229 | 250 | 3.038036% |
| C | 8229 | 43 | 0.522542% |
| D | 8229 | 356 | 4.326164% |
Noise dominated data is calculated using 1-second bins in cleaned event files. If a bin has >2000 counts, and if more than 50% of those come from <1% of pixels, then it is considered to be noise-dominated and hence unusable.
| Quadrant | # 1 sec bins | Bins with >0 counts | Bins with >2000 counts | High rate bins dominated by noise | Noise dominated (total time) | Noise dominated (detector-on time) | Marked lightcurve |
|---|---|---|---|---|---|---|---|
| A | 10352 | 8230 | 1 | 1 | 0.01% | 0.01% | 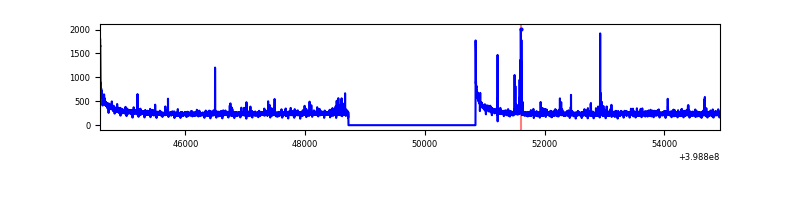 |
| B | 10351 | 8228 | 1 | 1 | 0.01% | 0.01% |  |
| C | 10351 | 8228 | 9 | 9 | 0.09% | 0.11% |  |
| D | 10351 | 8228 | 99 | 99 | 0.96% | 1.20% |  |
Top three noisy pixels from each quadrant. If the there are fewer than three noisy pixels in the level2.evt file, extra rows are filled as -1
| Pixel properties | Quadrant properties | ||||||
|---|---|---|---|---|---|---|---|
| Quadrant | DetID | PixID | Counts | Sigma | Mean | Median | Sigma |
| A | 10 | 83 | 354335 | 3587.5 | 446 | 441 | 98.6 |
| A | 13 | 248 | 44942 | 451.12 | 446 | 441 | 98.6 |
| A | 12 | 189 | 18888 | 187.0 | 446 | 441 | 98.6 |
| B | 12 | 18 | 202791 | 2319.79 | 443 | 436 | 87.2 |
| B | 0 | 213 | 132501 | 1513.99 | 443 | 436 | 87.2 |
| B | 5 | 255 | 121985 | 1393.43 | 443 | 436 | 87.2 |
| C | 15 | 214 | 326193 | 3098.57 | 450 | 450 | 105.1 |
| C | 0 | 10 | 143996 | 1365.45 | 450 | 450 | 105.1 |
| C | 1 | 23 | 20280 | 188.62 | 450 | 450 | 105.1 |
| D | 2 | 249 | 622959 | 5796.55 | 446 | 434 | 107.4 |
| D | 12 | 227 | 432547 | 4023.56 | 446 | 434 | 107.4 |
| D | 2 | 153 | 128851 | 1195.74 | 446 | 434 | 107.4 |
Histogram calculated using DETX and DETY for each event in the final _common_clean file
| Quadrant A |  |
 |
Quadrant B |
|---|---|---|---|
| Quadrant D |  |
 |
Quadrant C |
| Plot type | Count rate plots | Images |
|---|---|---|
| Comparison with Poisson distribution Blue bars denote a histogram of data divided into 1 sec bins. Red curve is a Poisson curve with rate = median count rate of data. |
 |
 |
| Quadrant-wise count rates Data is divided into 100 sec bins |
 |
|
| Module-wise count rates for Quadrant A Data is divided into 100 sec bins |
 |
 |
| Module-wise count rates for Quadrant B Data is divided into 100 sec bins |
 |
 |
| Module-wise count rates for Quadrant C Data is divided into 100 sec bins |
 |
 |
| Module-wise count rates for Quadrant D Data is divided into 100 sec bins |
 |
 |
| Parameter | Plot |
|---|---|
| CZT HV Monitor |  |
| D_VDD |  |
| Temperature 1 |  |
| Veto HV Monitor |  |
| Veto LLD |  |
| Alpha Counter |  |
| _CPM_Rate |  |
| CZT Counter |  |
| +2.5 Volts monitor |  |
| +5 Volts monitor |  |
| _ROLL_ROT |  |
| _Roll_DEC |  |
| _Roll_RA |  |
| Veto Counter |  |