| Param | Original file | Final file |
|---|---|---|
| Filename | modeM0/AS1A10_094T19_9000005300cztM0_level2_bc.evt | modeM0/AS1A10_094T19_9000005300cztM0_level2_quad_clean.evt |
| Size (bytes) | 175,017,600 | 85,553,280 |
| Size | 166.9 MB | 81.6 MB |
| Events in quadrant A | 1,127,523 | 570,012 |
| Events in quadrant B | 1,347,543 | 570,833 |
| Events in quadrant C | 1,245,338 | 572,284 |
| Events in quadrant D | 1,250,044 | 545,875 |
| Mode SS | |||
|---|---|---|---|
| Quadrant | BADHDUFLAG | Total packets | Discarded packets |
| A | 0 | 96 | 0 |
| B | 0 | 96 | 0 |
| C | 0 | 96 | 0 |
| D | 0 | 96 | 0 |
| Mode M9 | |||
|---|---|---|---|
| Quadrant | BADHDUFLAG | Total packets | Discarded packets |
| A | 0 | 12 | 0 |
| B | 0 | 12 | 0 |
| C | 0 | 12 | 0 |
| D | 0 | 12 | 0 |
| Mode M0 | |||
|---|---|---|---|
| Quadrant | BADHDUFLAG | Total packets | Discarded packets |
| A | 0 | 9949 | 0 |
| B | 0 | 10964 | 0 |
| C | 0 | 10118 | 0 |
| D | 0 | 10736 | 0 |
| Quadrant | Total seconds | Saturated seconds | Saturation percentage |
|---|---|---|---|
| A | 4723 | 18 | 0.381114% |
| B | 4723 | 66 | 1.397417% |
| C | 4723 | 24 | 0.508152% |
| D | 4723 | 67 | 1.418590% |
Noise dominated data is calculated using 1-second bins in cleaned event files. If a bin has >2000 counts, and if more than 50% of those come from <1% of pixels, then it is considered to be noise-dominated and hence unusable.
| Quadrant | # 1 sec bins | Bins with >0 counts | Bins with >2000 counts | High rate bins dominated by noise | Noise dominated (total time) | Noise dominated (detector-on time) | Marked lightcurve |
|---|---|---|---|---|---|---|---|
| A | 4723 | 4723 | 1 | 1 | 0.02% | 0.02% |  |
| B | 4722 | 4722 | 5 | 5 | 0.11% | 0.11% |  |
| C | 4722 | 4722 | 4 | 4 | 0.08% | 0.08% |  |
| D | 4723 | 4723 | 13 | 13 | 0.28% | 0.28% |  |
Top three noisy pixels from each quadrant. If the there are fewer than three noisy pixels in the level2.evt file, extra rows are filled as -1
| Pixel properties | Quadrant properties | ||||||
|---|---|---|---|---|---|---|---|
| Quadrant | DetID | PixID | Counts | Sigma | Mean | Median | Sigma |
| A | 10 | 83 | 184755 | 3427.75 | 227 | 223 | 53.8 |
| A | 9 | 143 | 20611 | 378.71 | 227 | 223 | 53.8 |
| A | 13 | 248 | 11668 | 212.6 | 227 | 223 | 53.8 |
| B | 5 | 200 | 185269 | 3861.41 | 226 | 220 | 47.9 |
| B | 0 | 213 | 149528 | 3115.61 | 226 | 220 | 47.9 |
| B | 5 | 172 | 100062 | 2083.4 | 226 | 220 | 47.9 |
| C | 15 | 214 | 186793 | 3434.94 | 223 | 220 | 54.3 |
| C | 1 | 23 | 76995 | 1413.48 | 223 | 220 | 54.3 |
| C | 0 | 10 | 64207 | 1178.04 | 223 | 220 | 54.3 |
| D | 13 | 249 | 117170 | 2086.1 | 225 | 218 | 56.1 |
| D | 2 | 249 | 60484 | 1074.98 | 225 | 218 | 56.1 |
| D | 12 | 233 | 50406 | 895.22 | 225 | 218 | 56.1 |
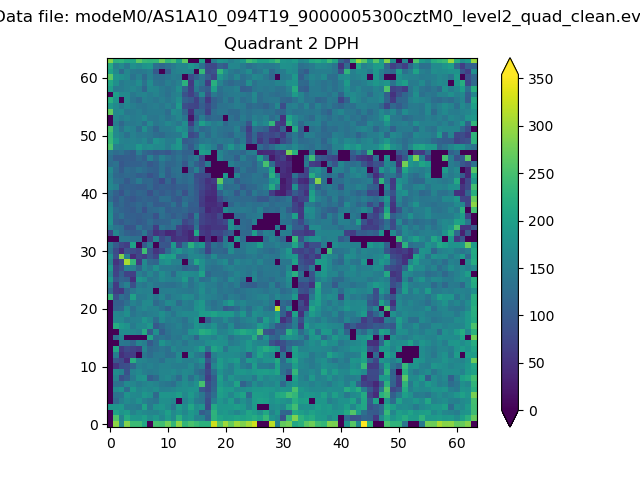
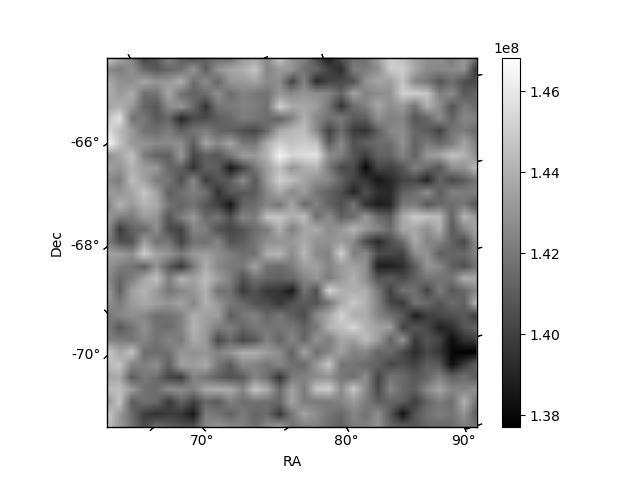
Histogram calculated using DETX and DETY for each event in the final _common_clean file
| Quadrant A | 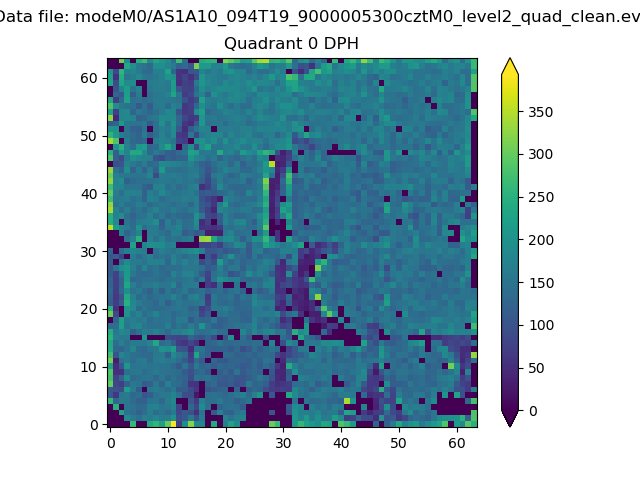 |
 |
Quadrant B |
|---|---|---|---|
| Quadrant D |  |
 |
Quadrant C |
| Plot type | Count rate plots | Images |
|---|---|---|
| Comparison with Poisson distribution Blue bars denote a histogram of data divided into 1 sec bins. Red curve is a Poisson curve with rate = median count rate of data. |
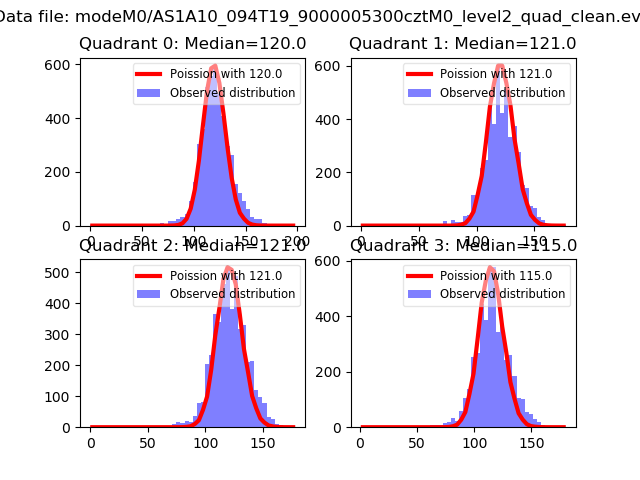 |
 |
| Quadrant-wise count rates Data is divided into 100 sec bins |
 |
|
| Module-wise count rates for Quadrant A Data is divided into 100 sec bins |
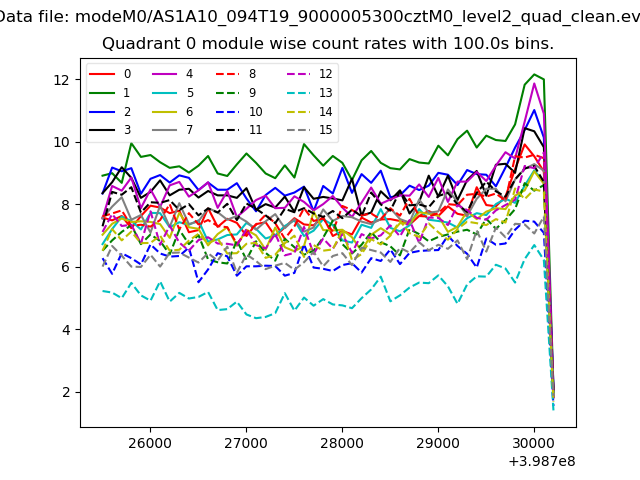 |
 |
| Module-wise count rates for Quadrant B Data is divided into 100 sec bins |
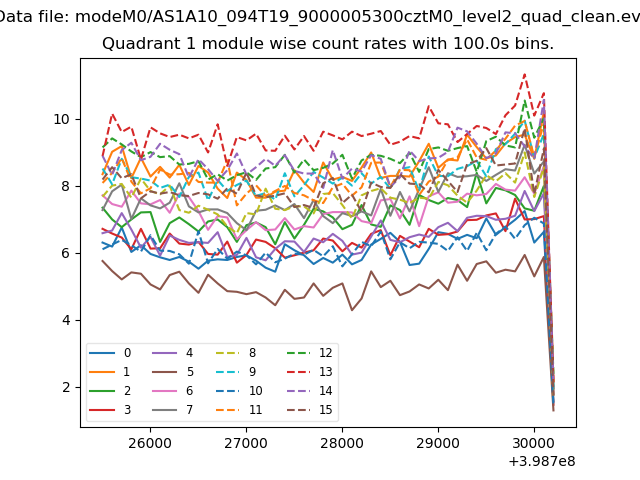 |
 |
| Module-wise count rates for Quadrant C Data is divided into 100 sec bins |
 |
 |
| Module-wise count rates for Quadrant D Data is divided into 100 sec bins |
 |
 |
| Parameter | Plot |
|---|---|
| CZT HV Monitor |  |
| D_VDD |  |
| Temperature 1 | 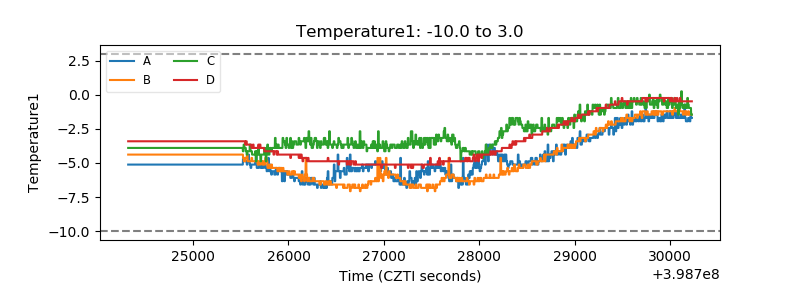 |
| Veto HV Monitor | 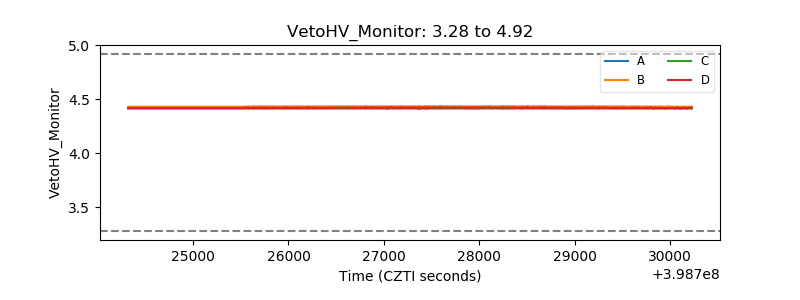 |
| Veto LLD |  |
| Alpha Counter |  |
| _CPM_Rate |  |
| CZT Counter |  |
| +2.5 Volts monitor |  |
| +5 Volts monitor |  |
| _ROLL_ROT |  |
| _Roll_DEC |  |
| _Roll_RA | 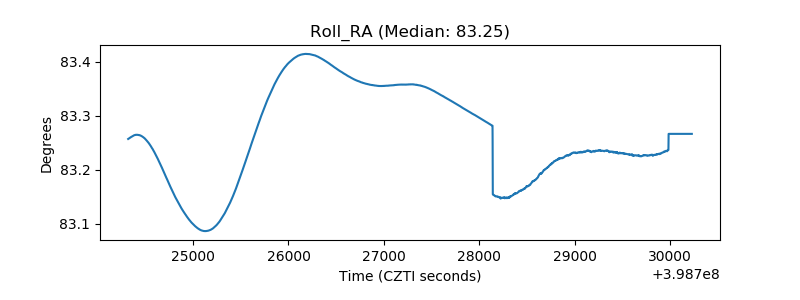 |
| Veto Counter |  |