| Param | Original file | Final file |
|---|---|---|
| Filename | modeM0/AS1A10_094T16_9000005298cztM0_level2_bc.evt | modeM0/AS1A10_094T16_9000005298cztM0_level2_quad_clean.evt |
| Size (bytes) | 302,330,880 | 128,741,760 |
| Size | 288.3 MB | 122.8 MB |
| Events in quadrant A | 1,676,782 | 881,366 |
| Events in quadrant B | 2,024,513 | 881,744 |
| Events in quadrant C | 1,857,552 | 885,856 |
| Events in quadrant D | 3,092,443 | 742,359 |
| Mode SS | |||
|---|---|---|---|
| Quadrant | BADHDUFLAG | Total packets | Discarded packets |
| A | 0 | 148 | 0 |
| B | 0 | 148 | 0 |
| C | 0 | 148 | 0 |
| D | 0 | 148 | 0 |
| Mode M9 | |||
|---|---|---|---|
| Quadrant | BADHDUFLAG | Total packets | Discarded packets |
| A | 0 | 14 | 0 |
| B | 0 | 14 | 0 |
| C | 0 | 14 | 0 |
| D | 0 | 14 | 0 |
| Mode M0 | |||
|---|---|---|---|
| Quadrant | BADHDUFLAG | Total packets | Discarded packets |
| A | 0 | 15065 | 0 |
| B | 0 | 16975 | 0 |
| C | 0 | 15425 | 0 |
| D | 0 | 25873 | 0 |
| Quadrant | Total seconds | Saturated seconds | Saturation percentage |
|---|---|---|---|
| A | 7288 | 19 | 0.260703% |
| B | 7288 | 150 | 2.058178% |
| C | 7288 | 39 | 0.535126% |
| D | 7288 | 1398 | 19.182217% |
Noise dominated data is calculated using 1-second bins in cleaned event files. If a bin has >2000 counts, and if more than 50% of those come from <1% of pixels, then it is considered to be noise-dominated and hence unusable.
| Quadrant | # 1 sec bins | Bins with >0 counts | Bins with >2000 counts | High rate bins dominated by noise | Noise dominated (total time) | Noise dominated (detector-on time) | Marked lightcurve |
|---|---|---|---|---|---|---|---|
| A | 8631 | 7289 | 4 | 4 | 0.05% | 0.05% |  |
| B | 8631 | 7288 | 8 | 8 | 0.09% | 0.11% | 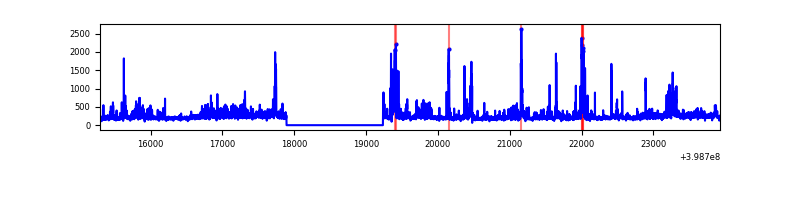 |
| C | 8631 | 7289 | 11 | 11 | 0.13% | 0.15% | 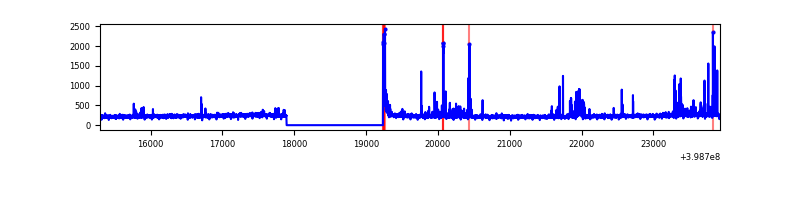 |
| D | 8631 | 7286 | 32 | 32 | 0.37% | 0.44% |  |
Top three noisy pixels from each quadrant. If the there are fewer than three noisy pixels in the level2.evt file, extra rows are filled as -1
| Pixel properties | Quadrant properties | ||||||
|---|---|---|---|---|---|---|---|
| Quadrant | DetID | PixID | Counts | Sigma | Mean | Median | Sigma |
| A | 10 | 83 | 246800 | 3045.55 | 352 | 345 | 80.9 |
| A | 9 | 143 | 27795 | 339.21 | 352 | 345 | 80.9 |
| A | 15 | 222 | 16818 | 203.56 | 352 | 345 | 80.9 |
| B | 5 | 172 | 254848 | 3518.14 | 350 | 342 | 72.3 |
| B | 0 | 213 | 245178 | 3384.47 | 350 | 342 | 72.3 |
| B | 0 | 189 | 55384 | 760.87 | 350 | 342 | 72.3 |
| C | 15 | 214 | 284095 | 3445.76 | 347 | 343 | 82.3 |
| C | 1 | 23 | 101368 | 1226.8 | 347 | 343 | 82.3 |
| C | 14 | 254 | 59663 | 720.36 | 347 | 343 | 82.3 |
| D | 2 | 249 | 1401553 | 18359.94 | 307 | 296 | 76.3 |
| D | 13 | 249 | 329393 | 4311.99 | 307 | 296 | 76.3 |
| D | 2 | 234 | 30149 | 391.15 | 307 | 296 | 76.3 |
Histogram calculated using DETX and DETY for each event in the final _common_clean file
| Quadrant A |  |
 |
Quadrant B |
|---|---|---|---|
| Quadrant D | 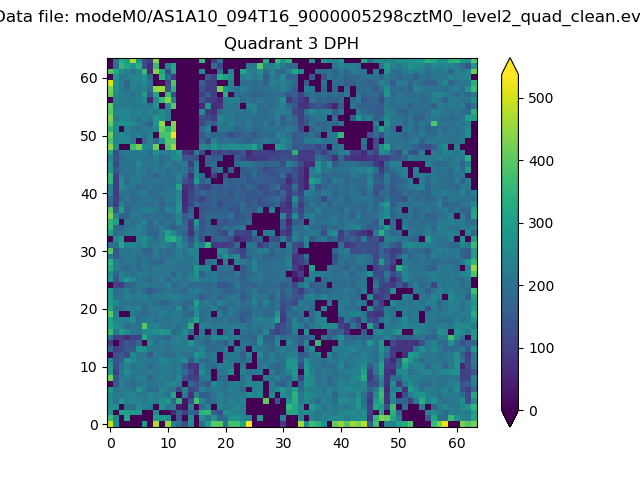 |
 |
Quadrant C |
| Plot type | Count rate plots | Images |
|---|---|---|
| Comparison with Poisson distribution Blue bars denote a histogram of data divided into 1 sec bins. Red curve is a Poisson curve with rate = median count rate of data. |
 |
 |
| Quadrant-wise count rates Data is divided into 100 sec bins |
 |
|
| Module-wise count rates for Quadrant A Data is divided into 100 sec bins |
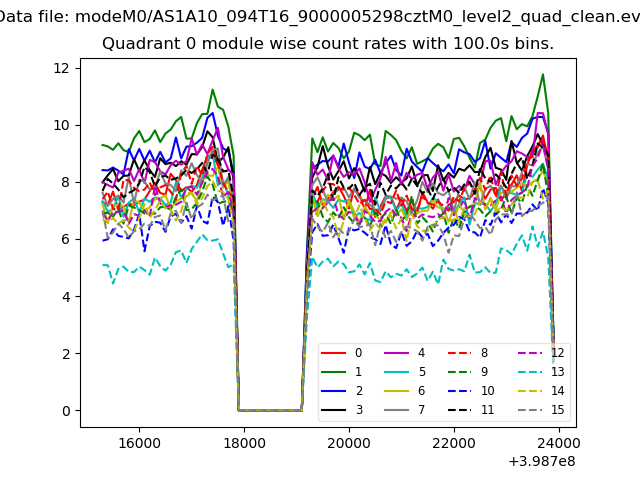 |
 |
| Module-wise count rates for Quadrant B Data is divided into 100 sec bins |
 |
 |
| Module-wise count rates for Quadrant C Data is divided into 100 sec bins |
 |
 |
| Module-wise count rates for Quadrant D Data is divided into 100 sec bins |
 |
 |
| Parameter | Plot |
|---|---|
| CZT HV Monitor |  |
| D_VDD |  |
| Temperature 1 |  |
| Veto HV Monitor | 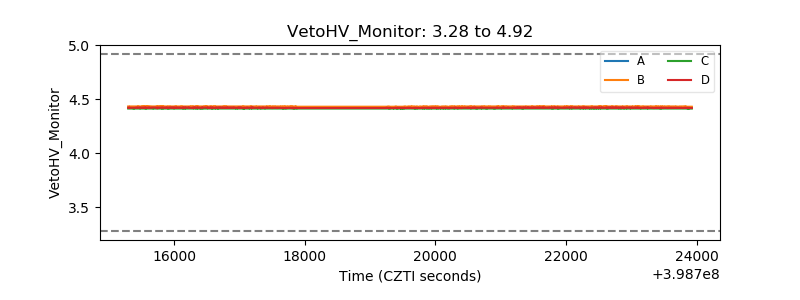 |
| Veto LLD | 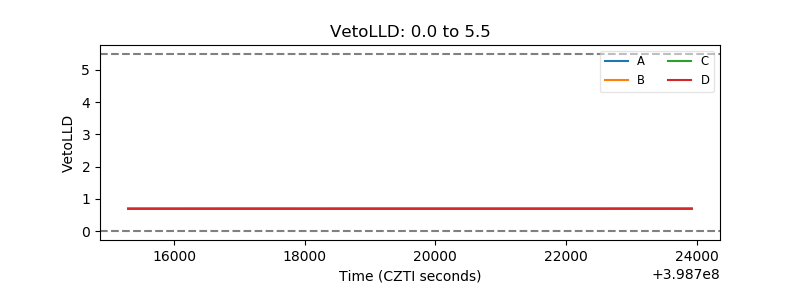 |
| Alpha Counter |  |
| _CPM_Rate |  |
| CZT Counter |  |
| +2.5 Volts monitor |  |
| +5 Volts monitor |  |
| _ROLL_ROT |  |
| _Roll_DEC |  |
| _Roll_RA |  |
| Veto Counter |  |