| Param | Original file | Final file |
|---|---|---|
| Filename | modeM0/AS1A10_094T11_9000005294cztM0_level2_bc.evt | modeM0/AS1A10_094T11_9000005294cztM0_level2_quad_clean.evt |
| Size (bytes) | 283,965,120 | 136,967,040 |
| Size | 270.8 MB | 130.6 MB |
| Events in quadrant A | 2,116,161 | 910,168 |
| Events in quadrant B | 1,762,658 | 933,765 |
| Events in quadrant C | 1,946,978 | 927,526 |
| Events in quadrant D | 2,297,766 | 897,257 |
| Mode M9 | |||
|---|---|---|---|
| Quadrant | BADHDUFLAG | Total packets | Discarded packets |
| A | 0 | 14 | 0 |
| B | 0 | 14 | 0 |
| C | 0 | 14 | 0 |
| D | 0 | 14 | 0 |
| Mode M0 | |||
|---|---|---|---|
| Quadrant | BADHDUFLAG | Total packets | Discarded packets |
| A | 0 | 16434 | 0 |
| B | 0 | 15367 | 0 |
| C | 0 | 15479 | 0 |
| D | 0 | 17265 | 0 |
| Mode SS | |||
|---|---|---|---|
| Quadrant | BADHDUFLAG | Total packets | Discarded packets |
| A | 0 | 138 | 0 |
| B | 0 | 138 | 0 |
| C | 0 | 138 | 0 |
| D | 0 | 138 | 0 |
| Quadrant | Total seconds | Saturated seconds | Saturation percentage |
|---|---|---|---|
| A | 6893 | 124 | 1.798926% |
| B | 6893 | 39 | 0.565791% |
| C | 6893 | 54 | 0.783403% |
| D | 6893 | 146 | 2.118091% |
Noise dominated data is calculated using 1-second bins in cleaned event files. If a bin has >2000 counts, and if more than 50% of those come from <1% of pixels, then it is considered to be noise-dominated and hence unusable.
| Quadrant | # 1 sec bins | Bins with >0 counts | Bins with >2000 counts | High rate bins dominated by noise | Noise dominated (total time) | Noise dominated (detector-on time) | Marked lightcurve |
|---|---|---|---|---|---|---|---|
| A | 8236 | 6894 | 8 | 8 | 0.10% | 0.12% |  |
| B | 8236 | 6894 | 3 | 3 | 0.04% | 0.04% |  |
| C | 8236 | 6893 | 9 | 9 | 0.11% | 0.13% |  |
| D | 8236 | 6893 | 20 | 20 | 0.24% | 0.29% |  |
Top three noisy pixels from each quadrant. If the there are fewer than three noisy pixels in the level2.evt file, extra rows are filled as -1
| Pixel properties | Quadrant properties | ||||||
|---|---|---|---|---|---|---|---|
| Quadrant | DetID | PixID | Counts | Sigma | Mean | Median | Sigma |
| A | 10 | 83 | 232907 | 2324.38 | 398 | 394 | 100.0 |
| A | 13 | 248 | 134943 | 1345.06 | 398 | 394 | 100.0 |
| A | 15 | 237 | 102371 | 1019.44 | 398 | 394 | 100.0 |
| B | 0 | 190 | 81532 | 963.11 | 370 | 361 | 84.3 |
| B | 0 | 230 | 77599 | 916.44 | 370 | 361 | 84.3 |
| B | 0 | 213 | 68720 | 811.09 | 370 | 361 | 84.3 |
| C | 15 | 214 | 269746 | 2927.69 | 357 | 354 | 92.0 |
| C | 14 | 254 | 166867 | 1809.62 | 357 | 354 | 92.0 |
| C | 0 | 10 | 81882 | 886.03 | 357 | 354 | 92.0 |
| D | 2 | 153 | 157338 | 1521.89 | 384 | 374 | 103.1 |
| D | 10 | 253 | 145239 | 1404.58 | 384 | 374 | 103.1 |
| D | 12 | 218 | 104234 | 1007.01 | 384 | 374 | 103.1 |
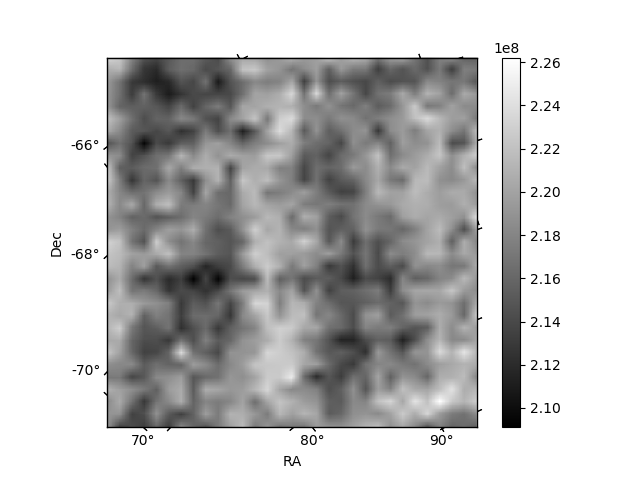
Histogram calculated using DETX and DETY for each event in the final _common_clean file
| Quadrant A |  |
 |
Quadrant B |
|---|---|---|---|
| Quadrant D |  |
 |
Quadrant C |
| Plot type | Count rate plots | Images |
|---|---|---|
| Comparison with Poisson distribution Blue bars denote a histogram of data divided into 1 sec bins. Red curve is a Poisson curve with rate = median count rate of data. |
 |
 |
| Quadrant-wise count rates Data is divided into 100 sec bins |
 |
|
| Module-wise count rates for Quadrant A Data is divided into 100 sec bins |
 |
 |
| Module-wise count rates for Quadrant B Data is divided into 100 sec bins |
 |
 |
| Module-wise count rates for Quadrant C Data is divided into 100 sec bins |
 |
 |
| Module-wise count rates for Quadrant D Data is divided into 100 sec bins |
 |
 |
| Parameter | Plot |
|---|---|
| CZT HV Monitor |  |
| D_VDD |  |
| Temperature 1 |  |
| Veto HV Monitor | 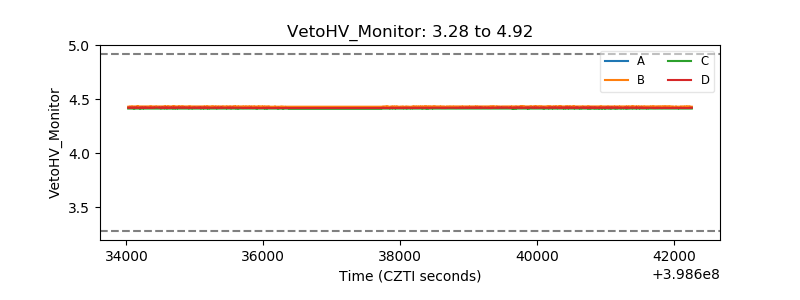 |
| Veto LLD |  |
| Alpha Counter | 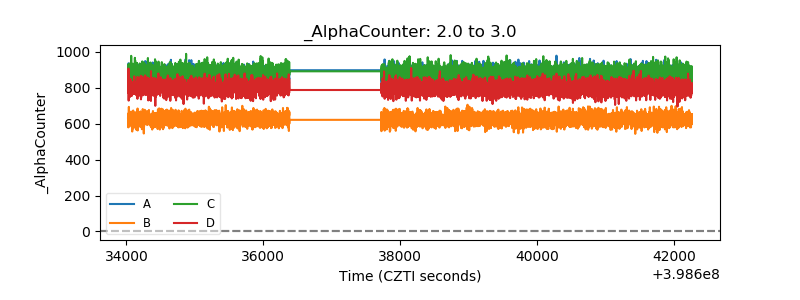 |
| _CPM_Rate |  |
| CZT Counter |  |
| +2.5 Volts monitor |  |
| +5 Volts monitor |  |
| _ROLL_ROT |  |
| _Roll_DEC |  |
| _Roll_RA |  |
| Veto Counter |  |