| Param | Original file | Final file |
|---|---|---|
| Filename | modeM0/AS1T04_087T01_9000005292cztM0_level2_bc.evt | modeM0/AS1T04_087T01_9000005292cztM0_level2_quad_clean.evt |
| Size (bytes) | 2,942,029,440 | 823,685,760 |
| Size | 2.7 GB | 785.5 MB |
| Events in quadrant A | 23,575,830 | 5,177,916 |
| Events in quadrant B | 18,533,439 | 5,240,402 |
| Events in quadrant C | 19,980,612 | 5,058,912 |
| Events in quadrant D | 22,445,044 | 4,870,089 |
| Mode M9 | |||
|---|---|---|---|
| Quadrant | BADHDUFLAG | Total packets | Discarded packets |
| A | 0 | 248 | 0 |
| B | 0 | 248 | 0 |
| C | 0 | 248 | 0 |
| D | 0 | 248 | 0 |
| Mode SS | |||
|---|---|---|---|
| Quadrant | BADHDUFLAG | Total packets | Discarded packets |
| A | 0 | 1374 | 0 |
| B | 0 | 1374 | 0 |
| C | 0 | 1374 | 0 |
| D | 0 | 1374 | 0 |
| Mode M0 | |||
|---|---|---|---|
| Quadrant | BADHDUFLAG | Total packets | Discarded packets |
| A | 0 | 169169 | 0 |
| B | 0 | 152901 | 0 |
| C | 0 | 151814 | 0 |
| D | 0 | 167114 | 0 |
| Quadrant | Total seconds | Saturated seconds | Saturation percentage |
|---|---|---|---|
| A | 67084 | 2818 | 4.200704% |
| B | 67084 | 713 | 1.062847% |
| C | 67084 | 863 | 1.286447% |
| D | 67084 | 2005 | 2.988790% |
Noise dominated data is calculated using 1-second bins in cleaned event files. If a bin has >2000 counts, and if more than 50% of those come from <1% of pixels, then it is considered to be noise-dominated and hence unusable.
| Quadrant | # 1 sec bins | Bins with >0 counts | Bins with >2000 counts | High rate bins dominated by noise | Noise dominated (total time) | Noise dominated (detector-on time) | Marked lightcurve |
|---|---|---|---|---|---|---|---|
| A | 97982 | 67109 | 779 | 779 | 0.80% | 1.16% |  |
| B | 97982 | 67100 | 59 | 59 | 0.06% | 0.09% |  |
| C | 97982 | 67100 | 237 | 237 | 0.24% | 0.35% |  |
| D | 97982 | 67100 | 358 | 358 | 0.37% | 0.53% |  |
Top three noisy pixels from each quadrant. If the there are fewer than three noisy pixels in the level2.evt file, extra rows are filled as -1
| Pixel properties | Quadrant properties | ||||||
|---|---|---|---|---|---|---|---|
| Quadrant | DetID | PixID | Counts | Sigma | Mean | Median | Sigma |
| A | 15 | 237 | 5445396 | 7154.92 | 3392 | 3334 | 760.6 |
| A | 10 | 83 | 2630686 | 3454.3 | 3392 | 3334 | 760.6 |
| A | 15 | 223 | 1553057 | 2037.49 | 3392 | 3334 | 760.6 |
| B | 0 | 213 | 1217367 | 1786.64 | 3442 | 3367 | 679.5 |
| B | 0 | 190 | 1041602 | 1527.97 | 3442 | 3367 | 679.5 |
| B | 5 | 172 | 931908 | 1366.53 | 3442 | 3367 | 679.5 |
| C | 14 | 254 | 2744532 | 3674.77 | 3287 | 3264 | 746.0 |
| C | 15 | 214 | 2666487 | 3570.15 | 3287 | 3264 | 746.0 |
| C | 0 | 10 | 781992 | 1043.91 | 3287 | 3264 | 746.0 |
| D | 2 | 249 | 3733189 | 4773.89 | 3333 | 3239 | 781.3 |
| D | 13 | 249 | 1106939 | 1412.6 | 3333 | 3239 | 781.3 |
| D | 2 | 153 | 1105521 | 1410.79 | 3333 | 3239 | 781.3 |
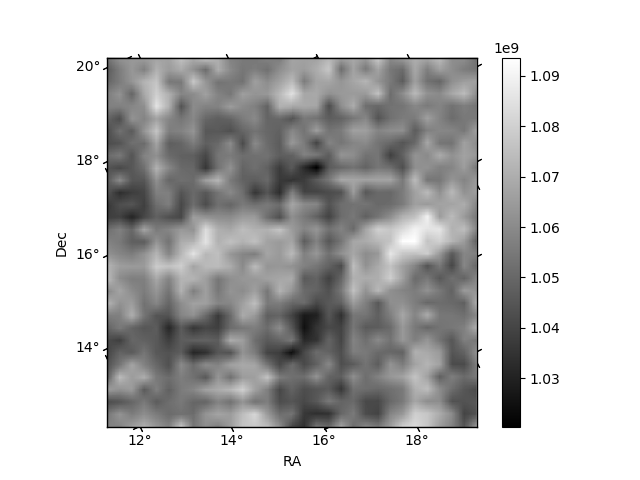
Histogram calculated using DETX and DETY for each event in the final _common_clean file
| Quadrant A |  |
 |
Quadrant B |
|---|---|---|---|
| Quadrant D |  |
 |
Quadrant C |
| Plot type | Count rate plots | Images |
|---|---|---|
| Comparison with Poisson distribution Blue bars denote a histogram of data divided into 1 sec bins. Red curve is a Poisson curve with rate = median count rate of data. |
 |
 |
| Quadrant-wise count rates Data is divided into 100 sec bins |
 |
|
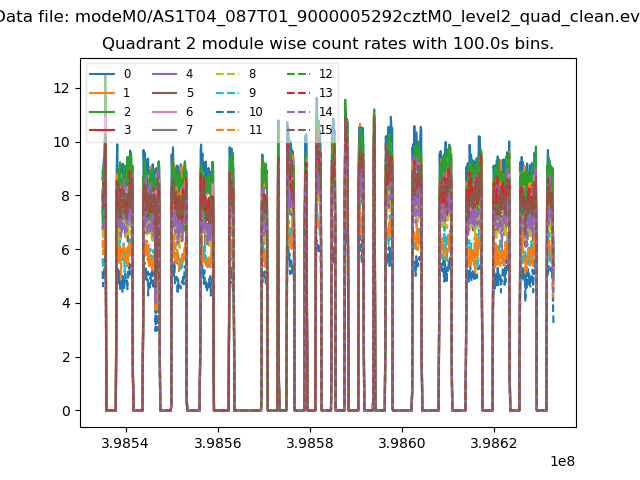
| Module-wise count rates for Quadrant A Data is divided into 100 sec bins |
 |
 |
| Module-wise count rates for Quadrant B Data is divided into 100 sec bins |
 |
 |
| Module-wise count rates for Quadrant C Data is divided into 100 sec bins |
 |
 |
| Module-wise count rates for Quadrant D Data is divided into 100 sec bins |
 |
 |
| Parameter | Plot |
|---|---|
| CZT HV Monitor |  |
| D_VDD |  |
| Temperature 1 | 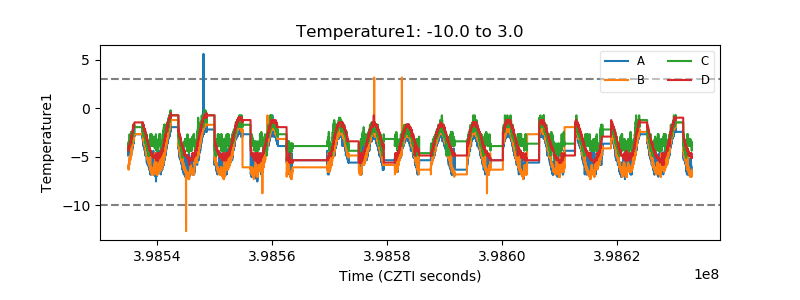 |
| Veto HV Monitor |  |
| Veto LLD |  |
| Alpha Counter |  |
| _CPM_Rate | 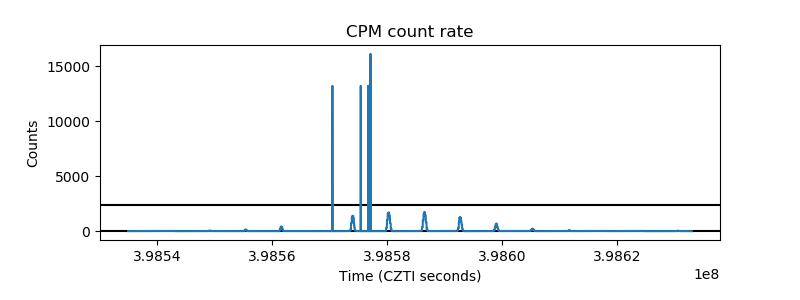 |
| CZT Counter |  |
| +2.5 Volts monitor |  |
| +5 Volts monitor |  |
| _ROLL_ROT |  |
| _Roll_DEC |  |
| _Roll_RA | 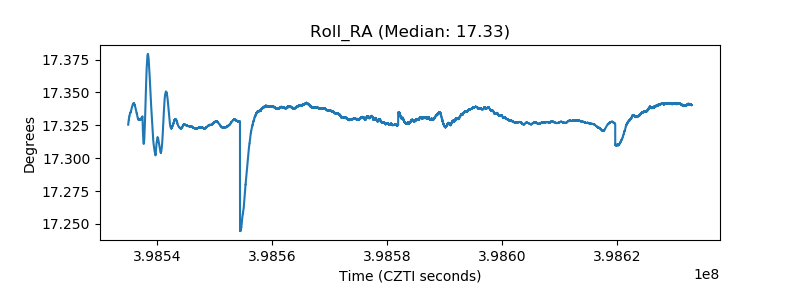 |
| Veto Counter | 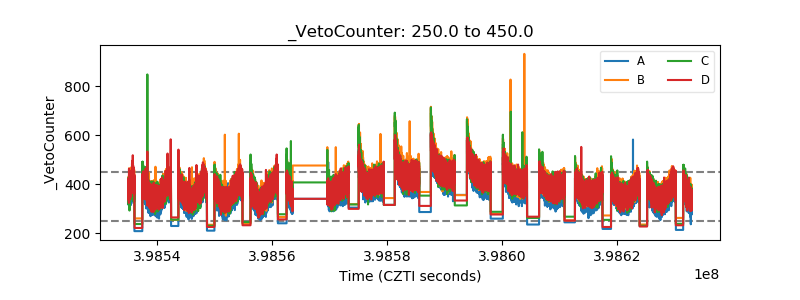 |