| Param | Original file | Final file |
|---|---|---|
| Filename | modeM0/AS1A10_094T07_9000005290cztM0_level2_bc.evt | modeM0/AS1A10_094T07_9000005290cztM0_level2_quad_clean.evt |
| Size (bytes) | 176,446,080 | 59,227,200 |
| Size | 168.3 MB | 56.5 MB |
| Events in quadrant A | 1,192,549 | 374,024 |
| Events in quadrant B | 1,232,037 | 389,412 |
| Events in quadrant C | 1,227,804 | 383,890 |
| Events in quadrant D | 1,417,481 | 370,167 |
| Mode SS | |||
|---|---|---|---|
| Quadrant | BADHDUFLAG | Total packets | Discarded packets |
| A | 0 | 82 | 0 |
| B | 0 | 82 | 0 |
| C | 0 | 82 | 0 |
| D | 0 | 82 | 0 |
| Mode M0 | |||
|---|---|---|---|
| Quadrant | BADHDUFLAG | Total packets | Discarded packets |
| A | 0 | 9577 | 0 |
| B | 0 | 9041 | 0 |
| C | 0 | 8839 | 0 |
| D | 0 | 9893 | 0 |
| Mode M9 | |||
|---|---|---|---|
| Quadrant | BADHDUFLAG | Total packets | Discarded packets |
| A | 0 | 16 | 0 |
| B | 0 | 16 | 0 |
| C | 0 | 16 | 0 |
| D | 0 | 16 | 0 |
| Quadrant | Total seconds | Saturated seconds | Saturation percentage |
|---|---|---|---|
| A | 3900 | 217 | 5.564103% |
| B | 3900 | 24 | 0.615385% |
| C | 3900 | 64 | 1.641026% |
| D | 3900 | 147 | 3.769231% |
Noise dominated data is calculated using 1-second bins in cleaned event files. If a bin has >2000 counts, and if more than 50% of those come from <1% of pixels, then it is considered to be noise-dominated and hence unusable.
| Quadrant | # 1 sec bins | Bins with >0 counts | Bins with >2000 counts | High rate bins dominated by noise | Noise dominated (total time) | Noise dominated (detector-on time) | Marked lightcurve |
|---|---|---|---|---|---|---|---|
| A | 5543 | 3900 | 13 | 13 | 0.23% | 0.33% |  |
| B | 5543 | 3900 | 1 | 1 | 0.02% | 0.03% |  |
| C | 5543 | 3900 | 19 | 19 | 0.34% | 0.49% |  |
| D | 5543 | 3900 | 36 | 36 | 0.65% | 0.92% |  |
Top three noisy pixels from each quadrant. If the there are fewer than three noisy pixels in the level2.evt file, extra rows are filled as -1
| Pixel properties | Quadrant properties | ||||||
|---|---|---|---|---|---|---|---|
| Quadrant | DetID | PixID | Counts | Sigma | Mean | Median | Sigma |
| A | 15 | 237 | 223367 | 5035.87 | 186 | 182 | 44.3 |
| A | 10 | 83 | 174198 | 3926.44 | 186 | 182 | 44.3 |
| A | 15 | 223 | 31926 | 716.26 | 186 | 182 | 44.3 |
| B | 4 | 80 | 181830 | 4416.65 | 191 | 187 | 41.1 |
| B | 0 | 230 | 75599 | 1833.64 | 191 | 187 | 41.1 |
| B | 5 | 200 | 59974 | 1453.72 | 191 | 187 | 41.1 |
| C | 15 | 214 | 156536 | 3350.96 | 187 | 185 | 46.7 |
| C | 14 | 254 | 120507 | 2578.77 | 187 | 185 | 46.7 |
| C | 12 | 247 | 108114 | 2313.16 | 187 | 185 | 46.7 |
| D | 10 | 253 | 159544 | 3338.54 | 188 | 182 | 47.7 |
| D | 13 | 249 | 82544 | 1725.43 | 188 | 182 | 47.7 |
| D | 1 | 52 | 78367 | 1637.93 | 188 | 182 | 47.7 |
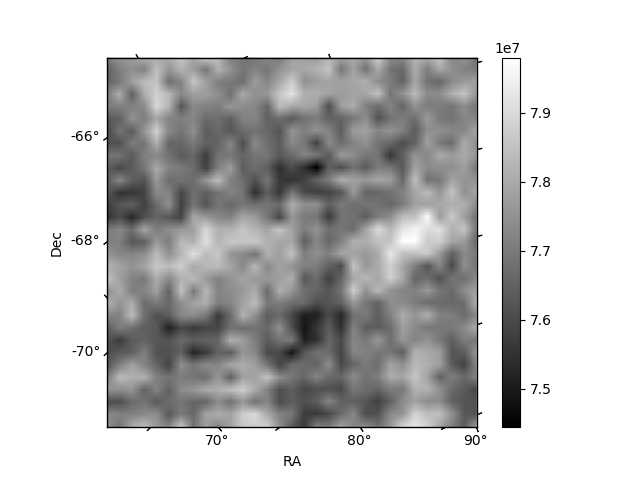
Histogram calculated using DETX and DETY for each event in the final _common_clean file
| Quadrant A |  |
 |
Quadrant B |
|---|---|---|---|
| Quadrant D | 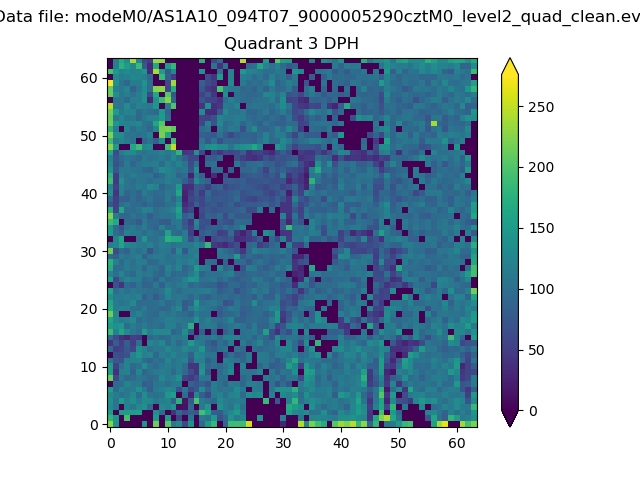 |
 |
Quadrant C |
| Plot type | Count rate plots | Images |
|---|---|---|
| Comparison with Poisson distribution Blue bars denote a histogram of data divided into 1 sec bins. Red curve is a Poisson curve with rate = median count rate of data. |
 |
 |
| Quadrant-wise count rates Data is divided into 100 sec bins |
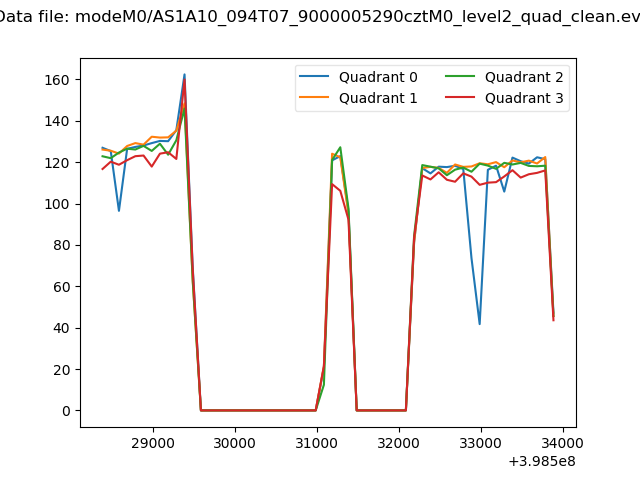 |
|
| Module-wise count rates for Quadrant A Data is divided into 100 sec bins |
 |
 |
| Module-wise count rates for Quadrant B Data is divided into 100 sec bins |
 |
 |
| Module-wise count rates for Quadrant C Data is divided into 100 sec bins |
 |
 |
| Module-wise count rates for Quadrant D Data is divided into 100 sec bins |
 |
 |
| Parameter | Plot |
|---|---|
| CZT HV Monitor |  |
| D_VDD |  |
| Temperature 1 |  |
| Veto HV Monitor | 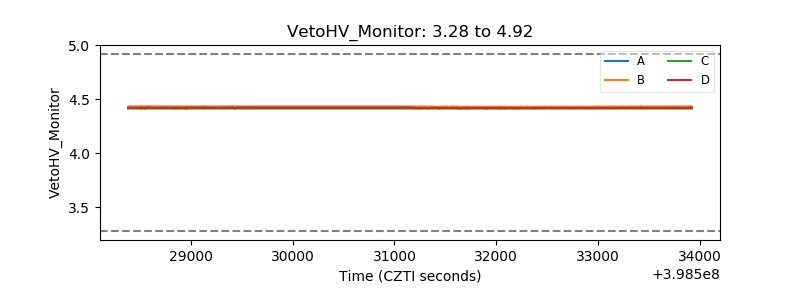 |
| Veto LLD |  |
| Alpha Counter |  |
| _CPM_Rate |  |
| CZT Counter | 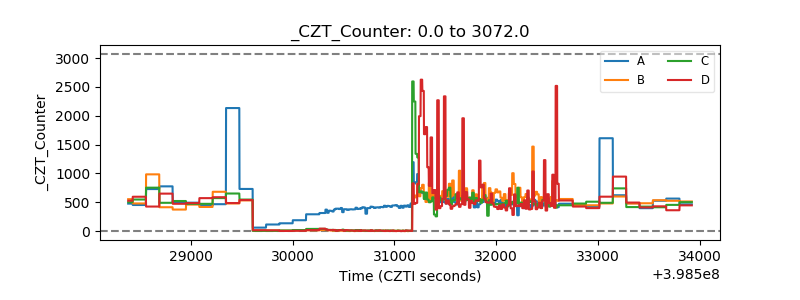 |
| +2.5 Volts monitor |  |
| +5 Volts monitor |  |
| _ROLL_ROT |  |
| _Roll_DEC |  |
| _Roll_RA |  |
| Veto Counter |  |