| Param | Original file | Final file |
|---|---|---|
| Filename | modeM0/AS1A10_094T04_9000005288cztM0_level2_bc.evt | modeM0/AS1A10_094T04_9000005288cztM0_level2_quad_clean.evt |
| Size (bytes) | 159,001,920 | 47,050,560 |
| Size | 151.6 MB | 44.9 MB |
| Events in quadrant A | 1,170,399 | 292,258 |
| Events in quadrant B | 917,673 | 306,217 |
| Events in quadrant C | 1,035,556 | 303,025 |
| Events in quadrant D | 1,458,606 | 287,989 |
| Mode M9 | |||
|---|---|---|---|
| Quadrant | BADHDUFLAG | Total packets | Discarded packets |
| A | 0 | 19 | 0 |
| B | 0 | 19 | 0 |
| C | 0 | 19 | 0 |
| D | 0 | 19 | 0 |
| Mode SS | |||
|---|---|---|---|
| Quadrant | BADHDUFLAG | Total packets | Discarded packets |
| A | 0 | 70 | 0 |
| B | 0 | 70 | 0 |
| C | 0 | 70 | 0 |
| D | 0 | 70 | 0 |
| Mode M0 | |||
|---|---|---|---|
| Quadrant | BADHDUFLAG | Total packets | Discarded packets |
| A | 0 | 8475 | 0 |
| B | 0 | 7417 | 0 |
| C | 0 | 7512 | 0 |
| D | 0 | 9073 | 0 |
| Quadrant | Total seconds | Saturated seconds | Saturation percentage |
|---|---|---|---|
| A | 3304 | 178 | 5.387409% |
| B | 3304 | 12 | 0.363196% |
| C | 3304 | 45 | 1.361985% |
| D | 3304 | 141 | 4.267554% |
Noise dominated data is calculated using 1-second bins in cleaned event files. If a bin has >2000 counts, and if more than 50% of those come from <1% of pixels, then it is considered to be noise-dominated and hence unusable.
| Quadrant | # 1 sec bins | Bins with >0 counts | Bins with >2000 counts | High rate bins dominated by noise | Noise dominated (total time) | Noise dominated (detector-on time) | Marked lightcurve |
|---|---|---|---|---|---|---|---|
| A | 5277 | 3305 | 22 | 22 | 0.42% | 0.67% |  |
| B | 5277 | 3304 | 0 | 0 | 0.00% | 0.00% |  |
| C | 5277 | 3305 | 13 | 13 | 0.25% | 0.39% |  |
| D | 5277 | 3304 | 72 | 72 | 1.36% | 2.18% |  |
Top three noisy pixels from each quadrant. If the there are fewer than three noisy pixels in the level2.evt file, extra rows are filled as -1
| Pixel properties | Quadrant properties | ||||||
|---|---|---|---|---|---|---|---|
| Quadrant | DetID | PixID | Counts | Sigma | Mean | Median | Sigma |
| A | 15 | 237 | 344908 | 9235.27 | 156 | 153 | 37.3 |
| A | 10 | 83 | 156580 | 4190.36 | 156 | 153 | 37.3 |
| A | 13 | 248 | 29051 | 774.12 | 156 | 153 | 37.3 |
| B | 5 | 200 | 111129 | 3204.61 | 161 | 158 | 34.6 |
| B | 0 | 190 | 54734 | 1576.04 | 161 | 158 | 34.6 |
| B | 0 | 230 | 33712 | 968.97 | 161 | 158 | 34.6 |
| C | 15 | 214 | 133149 | 3474.39 | 157 | 156 | 38.3 |
| C | 14 | 254 | 92766 | 2419.4 | 157 | 156 | 38.3 |
| C | 0 | 10 | 73391 | 1913.23 | 157 | 156 | 38.3 |
| D | 10 | 253 | 182404 | 4444.31 | 159 | 154 | 41.0 |
| D | 1 | 52 | 153625 | 3742.51 | 159 | 154 | 41.0 |
| D | 12 | 218 | 131397 | 3200.46 | 159 | 154 | 41.0 |
Histogram calculated using DETX and DETY for each event in the final _common_clean file
| Quadrant A | 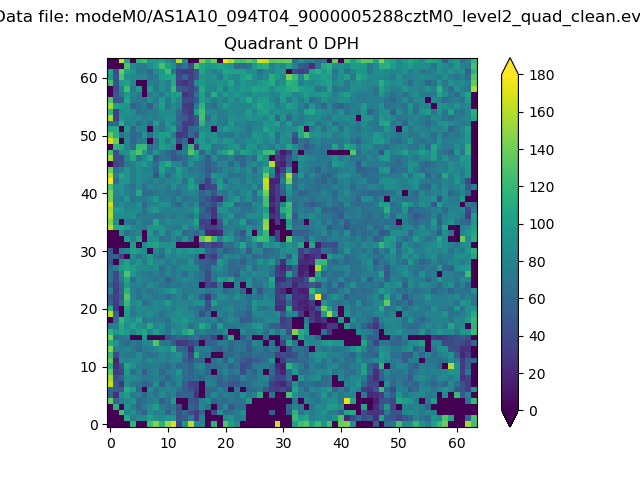 |
 |
Quadrant B |
|---|---|---|---|
| Quadrant D |  |
 |
Quadrant C |
| Plot type | Count rate plots | Images |
|---|---|---|
| Comparison with Poisson distribution Blue bars denote a histogram of data divided into 1 sec bins. Red curve is a Poisson curve with rate = median count rate of data. |
 |
 |
| Quadrant-wise count rates Data is divided into 100 sec bins |
 |
|
| Module-wise count rates for Quadrant A Data is divided into 100 sec bins |
 |
 |
| Module-wise count rates for Quadrant B Data is divided into 100 sec bins |
 |
 |
| Module-wise count rates for Quadrant C Data is divided into 100 sec bins |
 |
 |
| Module-wise count rates for Quadrant D Data is divided into 100 sec bins |
 |
 |
| Parameter | Plot |
|---|---|
| CZT HV Monitor |  |
| D_VDD |  |
| Temperature 1 |  |
| Veto HV Monitor |  |
| Veto LLD |  |
| Alpha Counter |  |
| _CPM_Rate |  |
| CZT Counter |  |
| +2.5 Volts monitor |  |
| +5 Volts monitor |  |
| _ROLL_ROT | 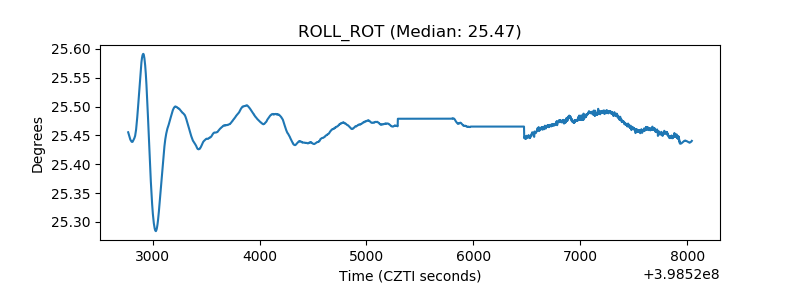 |
| _Roll_DEC |  |
| _Roll_RA |  |
| Veto Counter |  |