| Param | Original file | Final file |
|---|---|---|
| Filename | modeM0/AS1A10_123T11_9000005286cztM0_level2_bc.evt | modeM0/AS1A10_123T11_9000005286cztM0_level2_quad_clean.evt |
| Size (bytes) | 4,199,454,720 | 1,209,291,840 |
| Size | 3.9 GB | 1.1 GB |
| Events in quadrant A | 29,456,288 | 7,890,508 |
| Events in quadrant B | 27,299,278 | 7,956,052 |
| Events in quadrant C | 24,025,496 | 7,760,090 |
| Events in quadrant D | 40,687,407 | 7,257,435 |
| Mode M0 | |||
|---|---|---|---|
| Quadrant | BADHDUFLAG | Total packets | Discarded packets |
| A | 0 | 212895 | 0 |
| B | 0 | 208034 | 0 |
| C | 0 | 185280 | 0 |
| D | 0 | 251681 | 0 |
| Mode M9 | |||
|---|---|---|---|
| Quadrant | BADHDUFLAG | Total packets | Discarded packets |
| A | 0 | 341 | 0 |
| B | 0 | 341 | 0 |
| C | 0 | 341 | 0 |
| D | 0 | 341 | 0 |
| Mode SS | |||
|---|---|---|---|
| Quadrant | BADHDUFLAG | Total packets | Discarded packets |
| A | 0 | 1720 | 0 |
| B | 0 | 1720 | 0 |
| C | 0 | 1720 | 0 |
| D | 0 | 1720 | 0 |
| Quadrant | Total seconds | Saturated seconds | Saturation percentage |
|---|---|---|---|
| A | 84076 | 3633 | 4.321090% |
| B | 84076 | 1429 | 1.699653% |
| C | 84076 | 993 | 1.181074% |
| D | 84076 | 5653 | 6.723679% |
Noise dominated data is calculated using 1-second bins in cleaned event files. If a bin has >2000 counts, and if more than 50% of those come from <1% of pixels, then it is considered to be noise-dominated and hence unusable.
| Quadrant | # 1 sec bins | Bins with >0 counts | Bins with >2000 counts | High rate bins dominated by noise | Noise dominated (total time) | Noise dominated (detector-on time) | Marked lightcurve |
|---|---|---|---|---|---|---|---|
| A | 118196 | 84064 | 764 | 764 | 0.65% | 0.91% | 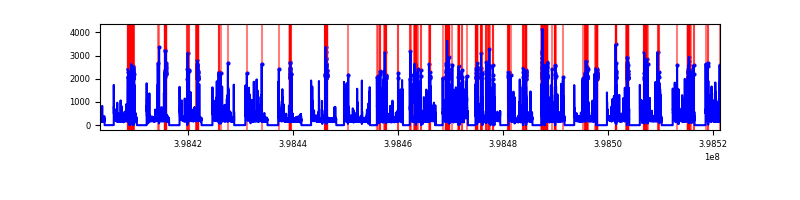 |
| B | 118196 | 84075 | 98 | 98 | 0.08% | 0.12% |  |
| C | 118196 | 84076 | 122 | 122 | 0.10% | 0.15% |  |
| D | 118196 | 84075 | 2025 | 2025 | 1.71% | 2.41% |  |
Top three noisy pixels from each quadrant. If the there are fewer than three noisy pixels in the level2.evt file, extra rows are filled as -1
| Pixel properties | Quadrant properties | ||||||
|---|---|---|---|---|---|---|---|
| Quadrant | DetID | PixID | Counts | Sigma | Mean | Median | Sigma |
| A | 15 | 237 | 6558010 | 6407.95 | 4541 | 4477 | 1022.7 |
| A | 10 | 83 | 3503500 | 3421.3 | 4541 | 4477 | 1022.7 |
| A | 9 | 143 | 671376 | 652.08 | 4541 | 4477 | 1022.7 |
| B | 0 | 190 | 1799688 | 1992.04 | 4525 | 4434 | 901.2 |
| B | 0 | 213 | 1329126 | 1469.9 | 4525 | 4434 | 901.2 |
| B | 5 | 172 | 1263264 | 1396.82 | 4525 | 4434 | 901.2 |
| C | 15 | 214 | 3361554 | 3399.64 | 4334 | 4314 | 987.5 |
| C | 14 | 254 | 1444841 | 1458.72 | 4334 | 4314 | 987.5 |
| C | 0 | 10 | 1297223 | 1309.24 | 4334 | 4314 | 987.5 |
| D | 10 | 253 | 5893935 | 5563.65 | 4379 | 4262 | 1058.6 |
| D | 2 | 249 | 4870999 | 4597.34 | 4379 | 4262 | 1058.6 |
| D | 12 | 248 | 1994358 | 1879.93 | 4379 | 4262 | 1058.6 |
Histogram calculated using DETX and DETY for each event in the final _common_clean file
| Quadrant A |  |
 |
Quadrant B |
|---|---|---|---|
| Quadrant D |  |
 |
Quadrant C |
| Plot type | Count rate plots | Images |
|---|---|---|
| Comparison with Poisson distribution Blue bars denote a histogram of data divided into 1 sec bins. Red curve is a Poisson curve with rate = median count rate of data. |
 |
 |
| Quadrant-wise count rates Data is divided into 100 sec bins |
 |
|
| Module-wise count rates for Quadrant A Data is divided into 100 sec bins |
 |
 |
| Module-wise count rates for Quadrant B Data is divided into 100 sec bins |
 |
 |
| Module-wise count rates for Quadrant C Data is divided into 100 sec bins |
 |
 |
| Module-wise count rates for Quadrant D Data is divided into 100 sec bins |
 |
 |
| Parameter | Plot |
|---|---|
| CZT HV Monitor |  |
| D_VDD |  |
| Temperature 1 |  |
| Veto HV Monitor |  |
| Veto LLD |  |
| Alpha Counter |  |
| _CPM_Rate |  |
| CZT Counter |  |
| +2.5 Volts monitor | 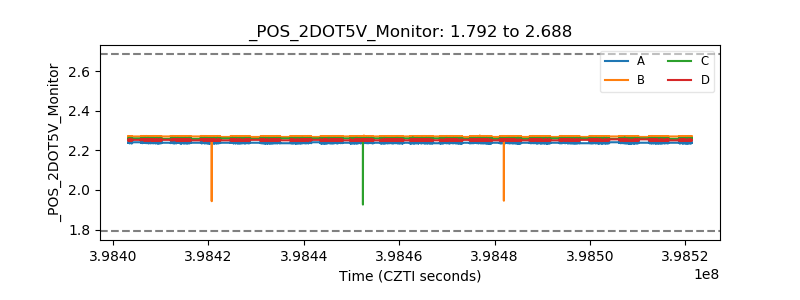 |
| +5 Volts monitor |  |
| _ROLL_ROT | 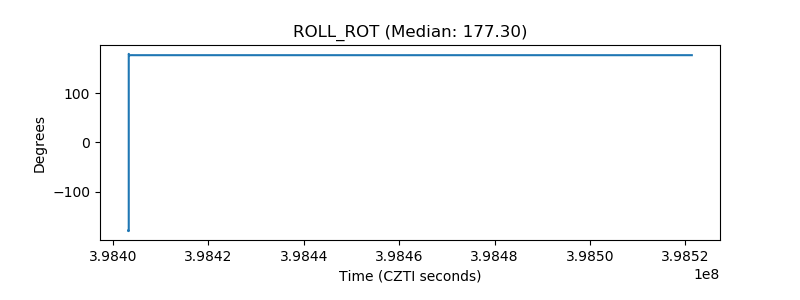 |
| _Roll_DEC |  |
| _Roll_RA | 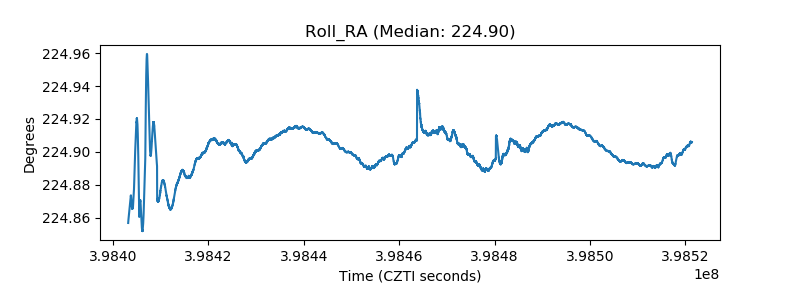 |
| Veto Counter | 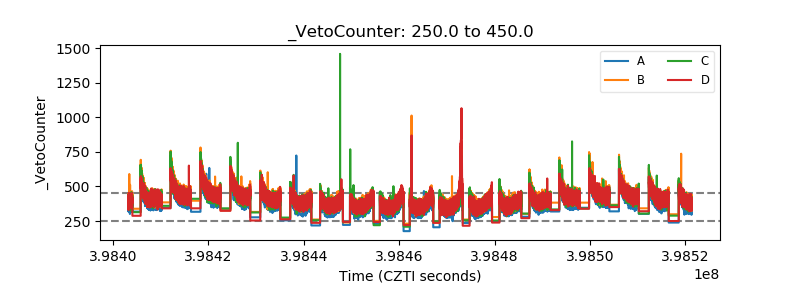 |