| Param | Original file | Final file |
|---|---|---|
| Filename | modeM0/AS1A11_079T01_9000005284cztM0_level2_bc.evt | modeM0/AS1A11_079T01_9000005284cztM0_level2_quad_clean.evt |
| Size (bytes) | 19,585,005,120 | 5,761,748,160 |
| Size | 18.2 GB | 5.4 GB |
| Events in quadrant A | 111,836,193 | 37,075,342 |
| Events in quadrant B | 129,838,961 | 36,703,548 |
| Events in quadrant C | 147,013,472 | 36,400,931 |
| Events in quadrant D | 174,236,754 | 33,888,128 |
| Mode M9 | |||
|---|---|---|---|
| Quadrant | BADHDUFLAG | Total packets | Discarded packets |
| A | 0 | 1676 | 0 |
| B | 0 | 1676 | 0 |
| C | 0 | 1676 | 0 |
| D | 0 | 1676 | 0 |
| Mode SS | |||
|---|---|---|---|
| Quadrant | BADHDUFLAG | Total packets | Discarded packets |
| A | 0 | 9086 | 0 |
| B | 0 | 9086 | 0 |
| C | 0 | 9086 | 0 |
| D | 0 | 9086 | 0 |
| Mode M0 | |||
|---|---|---|---|
| Quadrant | BADHDUFLAG | Total packets | Discarded packets |
| A | 0 | 947692 | 0 |
| B | 0 | 1046707 | 0 |
| C | 0 | 1048413 | 0 |
| D | 0 | 1199073 | 0 |
| Quadrant | Total seconds | Saturated seconds | Saturation percentage |
|---|---|---|---|
| A | 444754 | 1739 | 0.391003% |
| B | 444754 | 10540 | 2.369849% |
| C | 444754 | 6815 | 1.532308% |
| D | 444754 | 21036 | 4.729806% |
Noise dominated data is calculated using 1-second bins in cleaned event files. If a bin has >2000 counts, and if more than 50% of those come from <1% of pixels, then it is considered to be noise-dominated and hence unusable.
| Quadrant | # 1 sec bins | Bins with >0 counts | Bins with >2000 counts | High rate bins dominated by noise | Noise dominated (total time) | Noise dominated (detector-on time) | Marked lightcurve |
|---|---|---|---|---|---|---|---|
| A | 610963 | 444850 | 220 | 220 | 0.04% | 0.05% |  |
| B | 610962 | 444755 | 1176 | 1176 | 0.19% | 0.26% | 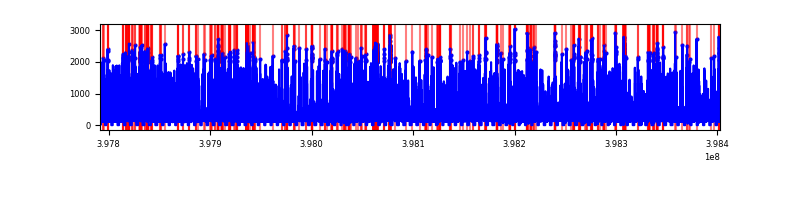 |
| C | 610962 | 444759 | 1725 | 1725 | 0.28% | 0.39% |  |
| D | 610962 | 444761 | 4835 | 4835 | 0.79% | 1.09% | 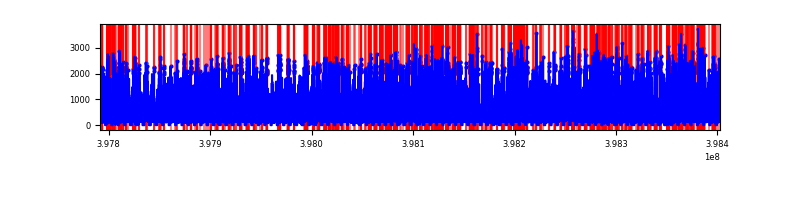 |
Top three noisy pixels from each quadrant. If the there are fewer than three noisy pixels in the level2.evt file, extra rows are filled as -1
| Pixel properties | Quadrant properties | ||||||
|---|---|---|---|---|---|---|---|
| Quadrant | DetID | PixID | Counts | Sigma | Mean | Median | Sigma |
| A | 10 | 83 | 16657463 | 3304.39 | 23207 | 22881 | 5034.1 |
| A | 15 | 237 | 1575079 | 308.34 | 23207 | 22881 | 5034.1 |
| A | 9 | 143 | 1369748 | 267.55 | 23207 | 22881 | 5034.1 |
| B | 5 | 172 | 15903135 | 3540.87 | 23066 | 22605 | 4484.9 |
| B | 4 | 251 | 6652829 | 1478.34 | 23066 | 22605 | 4484.9 |
| B | 5 | 184 | 5225502 | 1160.09 | 23066 | 22605 | 4484.9 |
| C | 10 | 49 | 18457003 | 3536.21 | 22549 | 22400 | 5213.1 |
| C | 15 | 214 | 18200481 | 3487.0 | 22549 | 22400 | 5213.1 |
| C | 14 | 254 | 9952064 | 1904.75 | 22549 | 22400 | 5213.1 |
| D | 2 | 249 | 25054786 | 4790.13 | 22371 | 21730 | 5226.0 |
| D | 10 | 253 | 15075013 | 2880.48 | 22371 | 21730 | 5226.0 |
| D | 1 | 52 | 8356392 | 1594.86 | 22371 | 21730 | 5226.0 |
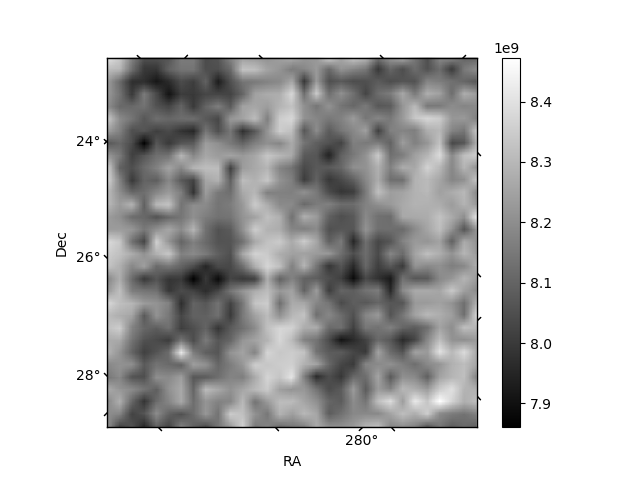
Histogram calculated using DETX and DETY for each event in the final _common_clean file
| Quadrant A |  |
 |
Quadrant B |
|---|---|---|---|
| Quadrant D | 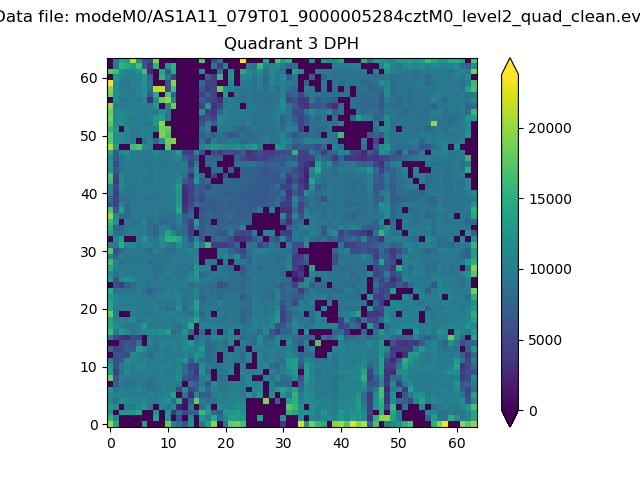 |
 |
Quadrant C |
| Plot type | Count rate plots | Images |
|---|---|---|
| Comparison with Poisson distribution Blue bars denote a histogram of data divided into 1 sec bins. Red curve is a Poisson curve with rate = median count rate of data. |
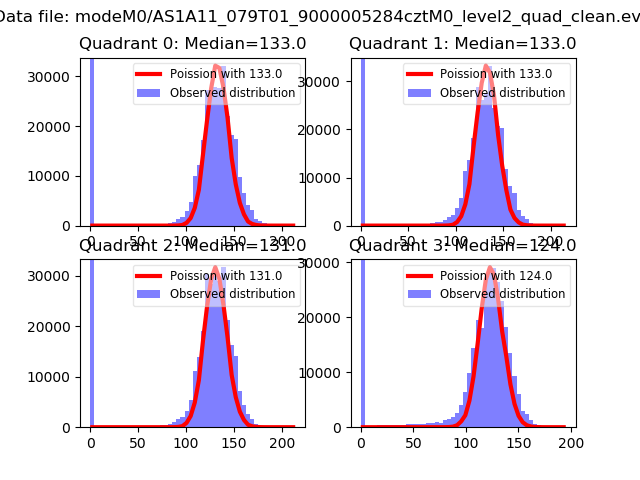 |
 |
| Quadrant-wise count rates Data is divided into 100 sec bins |
 |
|
| Module-wise count rates for Quadrant A Data is divided into 100 sec bins |
 |
 |
| Module-wise count rates for Quadrant B Data is divided into 100 sec bins |
 |
 |
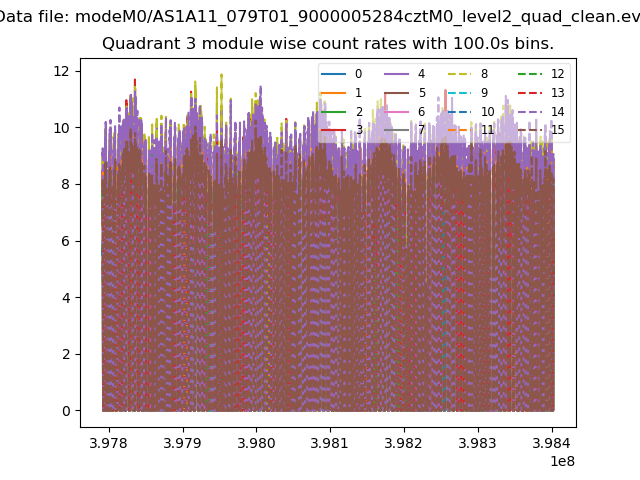
| Module-wise count rates for Quadrant C Data is divided into 100 sec bins |
 |
 |
| Module-wise count rates for Quadrant D Data is divided into 100 sec bins |
 |
 |
| Parameter | Plot |
|---|---|
| CZT HV Monitor |  |
| D_VDD |  |
| Temperature 1 |  |
| Veto HV Monitor |  |
| Veto LLD | 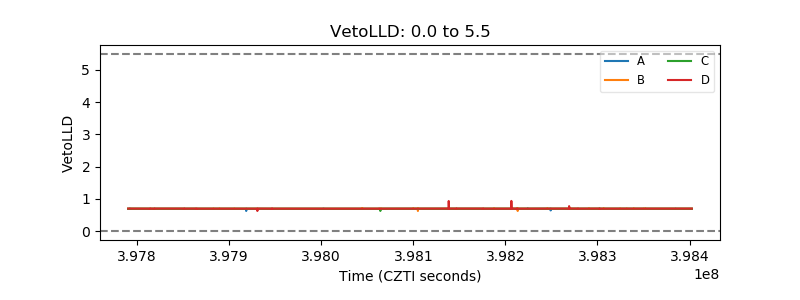 |
| Alpha Counter |  |
| _CPM_Rate |  |
| CZT Counter |  |
| +2.5 Volts monitor | 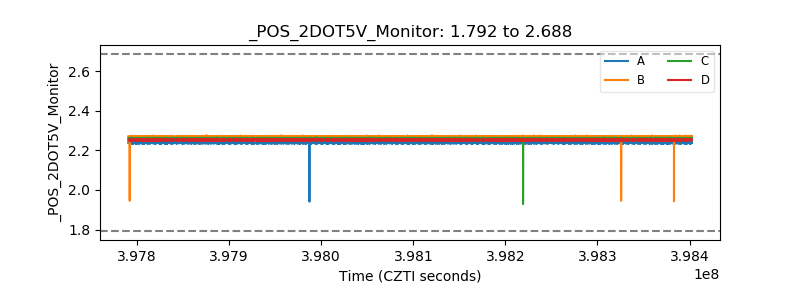 |
| +5 Volts monitor | 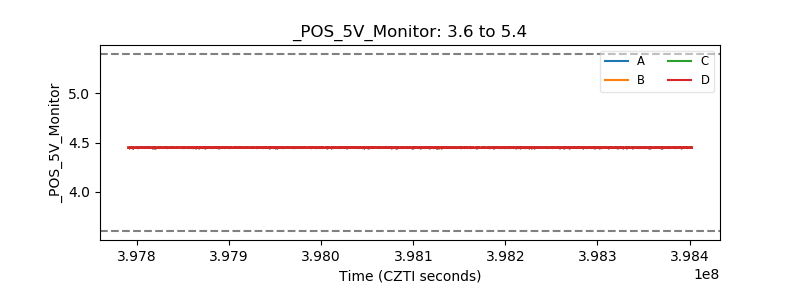 |
| _ROLL_ROT |  |
| _Roll_DEC |  |
| _Roll_RA | 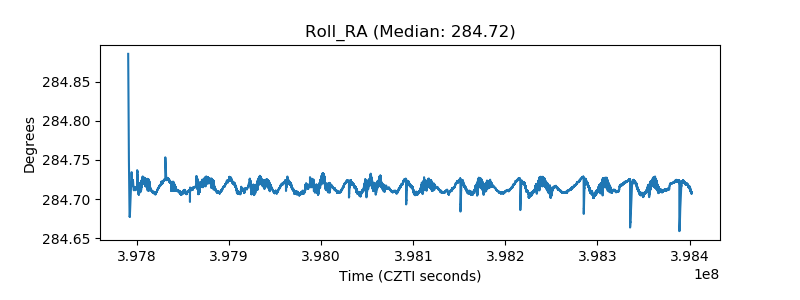 |
| Veto Counter |  |