| Param | Original file | Final file |
|---|---|---|
| Filename | modeM0/AS1A09_138T04_9000005282cztM0_level2_bc.evt | modeM0/AS1A09_138T04_9000005282cztM0_level2_quad_clean.evt |
| Size (bytes) | 9,960,684,480 | 2,818,774,080 |
| Size | 9.3 GB | 2.6 GB |
| Events in quadrant A | 60,758,849 | 17,898,009 |
| Events in quadrant B | 69,606,534 | 17,738,401 |
| Events in quadrant C | 62,552,178 | 17,443,494 |
| Events in quadrant D | 93,102,355 | 16,537,904 |
| Mode SS | |||
|---|---|---|---|
| Quadrant | BADHDUFLAG | Total packets | Discarded packets |
| A | 0 | 4708 | 0 |
| B | 0 | 4708 | 0 |
| C | 0 | 4708 | 0 |
| D | 0 | 4708 | 0 |
| Mode M0 | |||
|---|---|---|---|
| Quadrant | BADHDUFLAG | Total packets | Discarded packets |
| A | 0 | 498515 | 0 |
| B | 0 | 558597 | 0 |
| C | 0 | 495020 | 0 |
| D | 0 | 641525 | 0 |
| Mode M9 | |||
|---|---|---|---|
| Quadrant | BADHDUFLAG | Total packets | Discarded packets |
| A | 0 | 880 | 0 |
| B | 0 | 880 | 0 |
| C | 0 | 880 | 0 |
| D | 0 | 880 | 0 |
| Quadrant | Total seconds | Saturated seconds | Saturation percentage |
|---|---|---|---|
| A | 230114 | 1448 | 0.629253% |
| B | 230113 | 8829 | 3.836811% |
| C | 230114 | 1543 | 0.670537% |
| D | 230114 | 11045 | 4.799795% |
Noise dominated data is calculated using 1-second bins in cleaned event files. If a bin has >2000 counts, and if more than 50% of those come from <1% of pixels, then it is considered to be noise-dominated and hence unusable.
| Quadrant | # 1 sec bins | Bins with >0 counts | Bins with >2000 counts | High rate bins dominated by noise | Noise dominated (total time) | Noise dominated (detector-on time) | Marked lightcurve |
|---|---|---|---|---|---|---|---|
| A | 316859 | 230141 | 120 | 120 | 0.04% | 0.05% |  |
| B | 316858 | 230089 | 519 | 519 | 0.16% | 0.23% |  |
| C | 316858 | 230118 | 338 | 338 | 0.11% | 0.15% |  |
| D | 316859 | 230081 | 1601 | 1601 | 0.51% | 0.70% |  |
Top three noisy pixels from each quadrant. If the there are fewer than three noisy pixels in the level2.evt file, extra rows are filled as -1
| Pixel properties | Quadrant properties | ||||||
|---|---|---|---|---|---|---|---|
| Quadrant | DetID | PixID | Counts | Sigma | Mean | Median | Sigma |
| A | 10 | 83 | 8947658 | 3327.39 | 12133 | 11950 | 2685.5 |
| A | 7 | 3 | 1585248 | 585.85 | 12133 | 11950 | 2685.5 |
| A | 15 | 237 | 1424927 | 526.15 | 12133 | 11950 | 2685.5 |
| B | 5 | 184 | 8183476 | 3488.61 | 11928 | 11668 | 2342.4 |
| B | 5 | 172 | 7430776 | 3167.28 | 11928 | 11668 | 2342.4 |
| B | 0 | 229 | 2014620 | 855.08 | 11928 | 11668 | 2342.4 |
| C | 15 | 214 | 9207773 | 3479.06 | 11669 | 11605 | 2643.3 |
| C | 0 | 10 | 3028119 | 1141.2 | 11669 | 11605 | 2643.3 |
| C | 1 | 23 | 1291673 | 484.27 | 11669 | 11605 | 2643.3 |
| D | 1 | 52 | 8310939 | 3037.91 | 11601 | 11278 | 2732.0 |
| D | 13 | 249 | 4867636 | 1777.56 | 11601 | 11278 | 2732.0 |
| D | 1 | 47 | 4435171 | 1619.27 | 11601 | 11278 | 2732.0 |
Histogram calculated using DETX and DETY for each event in the final _common_clean file
| Quadrant A |  |
 |
Quadrant B |
|---|---|---|---|
| Quadrant D | 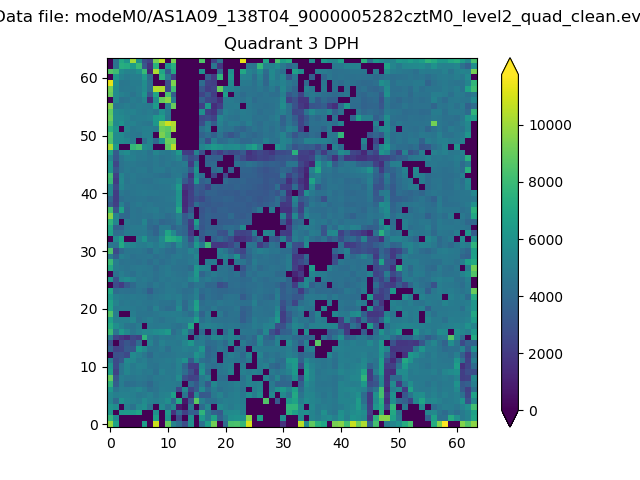 |
 |
Quadrant C |
| Plot type | Count rate plots | Images |
|---|---|---|
| Comparison with Poisson distribution Blue bars denote a histogram of data divided into 1 sec bins. Red curve is a Poisson curve with rate = median count rate of data. |
 |
 |
| Quadrant-wise count rates Data is divided into 100 sec bins |
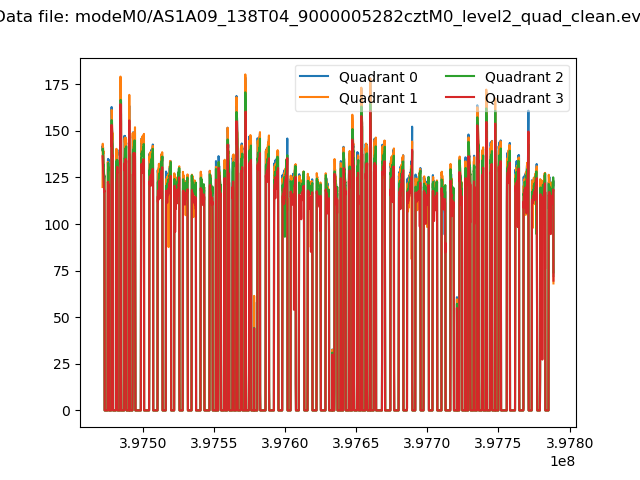 |
|
| Module-wise count rates for Quadrant A Data is divided into 100 sec bins |
 |
 |
| Module-wise count rates for Quadrant B Data is divided into 100 sec bins |
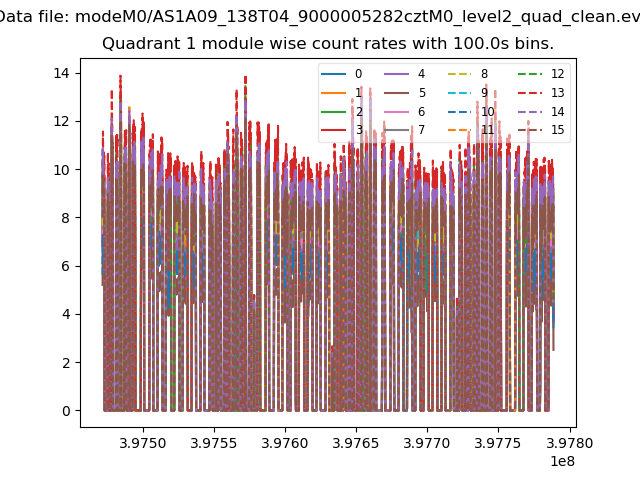 |
 |
| Module-wise count rates for Quadrant C Data is divided into 100 sec bins |
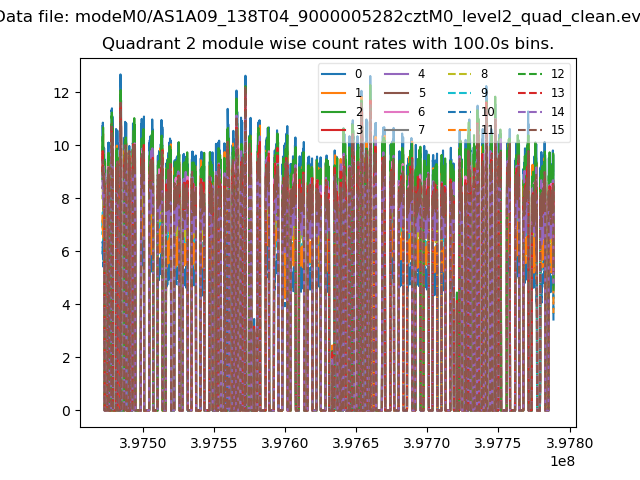 |
 |
| Module-wise count rates for Quadrant D Data is divided into 100 sec bins |
 |
 |
| Parameter | Plot |
|---|---|
| CZT HV Monitor |  |
| D_VDD |  |
| Temperature 1 |  |
| Veto HV Monitor |  |
| Veto LLD |  |
| Alpha Counter |  |
| _CPM_Rate |  |
| CZT Counter | 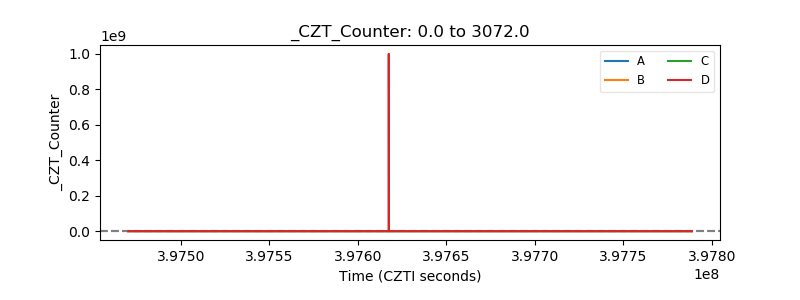 |
| +2.5 Volts monitor |  |
| +5 Volts monitor |  |
| _ROLL_ROT |  |
| _Roll_DEC |  |
| _Roll_RA |  |
| Veto Counter |  |