| Param | Original file | Final file |
|---|---|---|
| Filename | modeM0/AS1A09_026T03_9000005280cztM0_level2_bc.evt | modeM0/AS1A09_026T03_9000005280cztM0_level2_quad_clean.evt |
| Size (bytes) | 727,004,160 | 152,835,840 |
| Size | 693.3 MB | 145.8 MB |
| Events in quadrant A | 3,161,478 | 1,030,611 |
| Events in quadrant B | 5,753,471 | 982,309 |
| Events in quadrant C | 3,789,378 | 1,001,267 |
| Events in quadrant D | 8,432,094 | 724,910 |
| Mode M9 | |||
|---|---|---|---|
| Quadrant | BADHDUFLAG | Total packets | Discarded packets |
| A | 0 | 39 | 0 |
| B | 0 | 39 | 0 |
| C | 0 | 39 | 0 |
| D | 0 | 39 | 0 |
| Mode SS | |||
|---|---|---|---|
| Quadrant | BADHDUFLAG | Total packets | Discarded packets |
| A | 0 | 262 | 0 |
| B | 0 | 262 | 0 |
| C | 0 | 262 | 0 |
| D | 0 | 262 | 0 |
| Mode M0 | |||
|---|---|---|---|
| Quadrant | BADHDUFLAG | Total packets | Discarded packets |
| A | 0 | 26992 | 0 |
| B | 0 | 38228 | 0 |
| C | 0 | 28683 | 0 |
| D | 0 | 55380 | 0 |
| Quadrant | Total seconds | Saturated seconds | Saturation percentage |
|---|---|---|---|
| A | 12846 | 41 | 0.319165% |
| B | 12846 | 1044 | 8.127043% |
| C | 12846 | 166 | 1.292231% |
| D | 12846 | 3135 | 24.404484% |
Noise dominated data is calculated using 1-second bins in cleaned event files. If a bin has >2000 counts, and if more than 50% of those come from <1% of pixels, then it is considered to be noise-dominated and hence unusable.
| Quadrant | # 1 sec bins | Bins with >0 counts | Bins with >2000 counts | High rate bins dominated by noise | Noise dominated (total time) | Noise dominated (detector-on time) | Marked lightcurve |
|---|---|---|---|---|---|---|---|
| A | 15802 | 12848 | 4 | 4 | 0.03% | 0.03% |  |
| B | 15801 | 12844 | 75 | 75 | 0.47% | 0.58% | 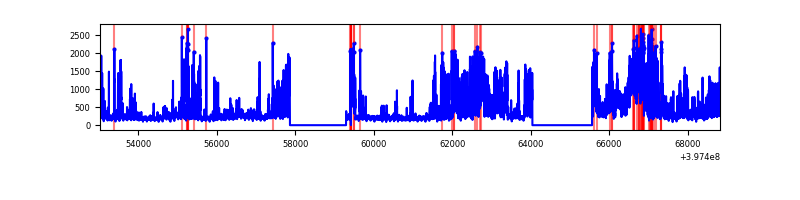 |
| C | 15801 | 12844 | 67 | 67 | 0.42% | 0.52% |  |
| D | 15801 | 12827 | 89 | 89 | 0.56% | 0.69% | 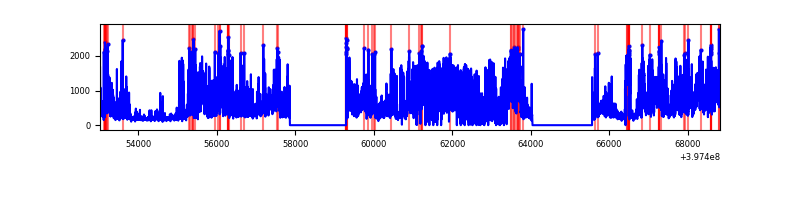 |
Top three noisy pixels from each quadrant. If the there are fewer than three noisy pixels in the level2.evt file, extra rows are filled as -1
| Pixel properties | Quadrant properties | ||||||
|---|---|---|---|---|---|---|---|
| Quadrant | DetID | PixID | Counts | Sigma | Mean | Median | Sigma |
| A | 10 | 83 | 512546 | 3604.4 | 628 | 614 | 142.0 |
| A | 9 | 143 | 131384 | 920.72 | 628 | 614 | 142.0 |
| A | 12 | 189 | 35064 | 242.56 | 628 | 614 | 142.0 |
| B | 5 | 184 | 2707110 | 21939.96 | 611 | 599 | 123.4 |
| B | 0 | 229 | 330211 | 2671.95 | 611 | 599 | 123.4 |
| B | 5 | 172 | 154470 | 1247.33 | 611 | 599 | 123.4 |
| C | 15 | 214 | 519997 | 3603.02 | 613 | 606 | 144.2 |
| C | 0 | 10 | 314681 | 2178.74 | 613 | 606 | 144.2 |
| C | 1 | 23 | 229606 | 1588.58 | 613 | 606 | 144.2 |
| D | 12 | 17 | 2995460 | 23488.63 | 520 | 501 | 127.5 |
| D | 6 | 112 | 1087971 | 8528.72 | 520 | 501 | 127.5 |
| D | 12 | 235 | 844049 | 6615.71 | 520 | 501 | 127.5 |
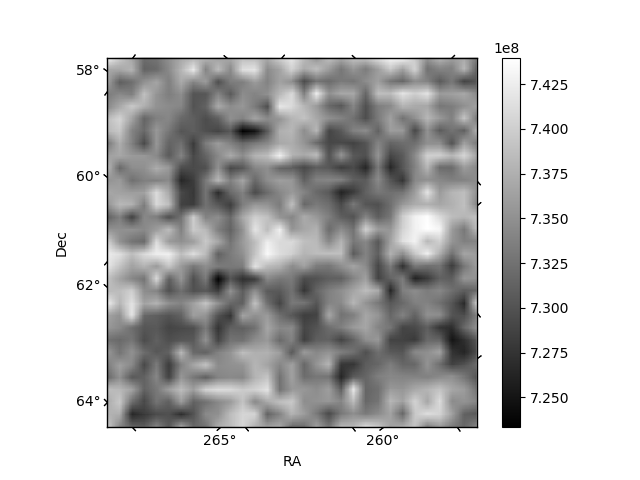
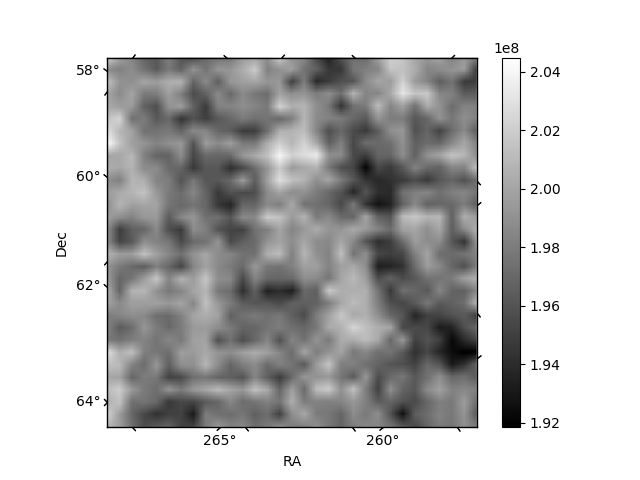
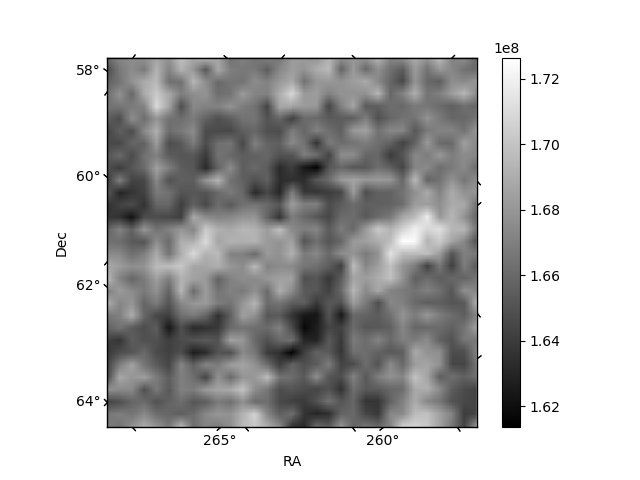
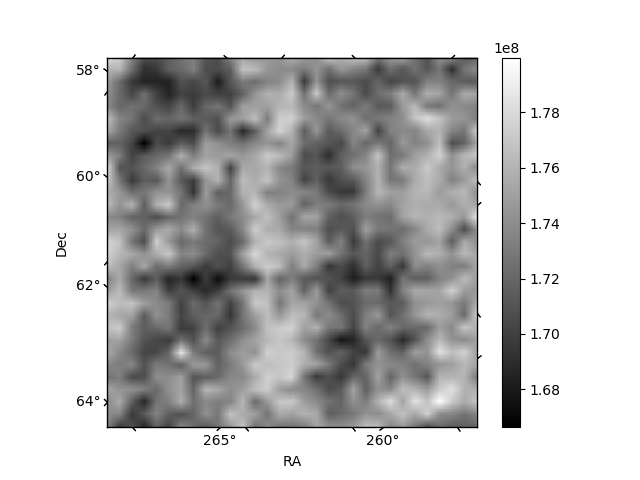
Histogram calculated using DETX and DETY for each event in the final _common_clean file
| Quadrant A | 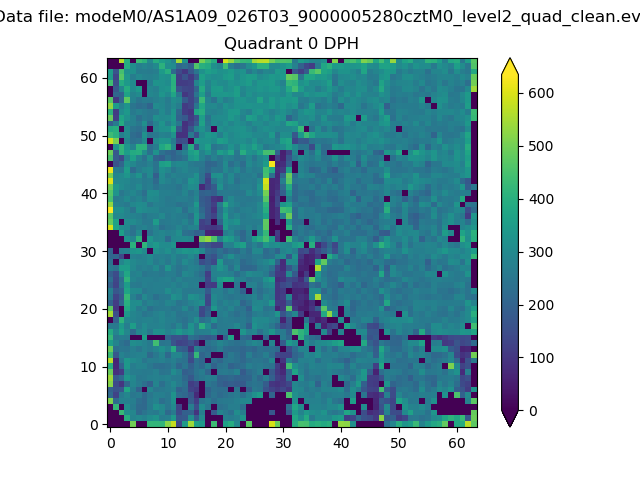 |
 |
Quadrant B |
|---|---|---|---|
| Quadrant D | 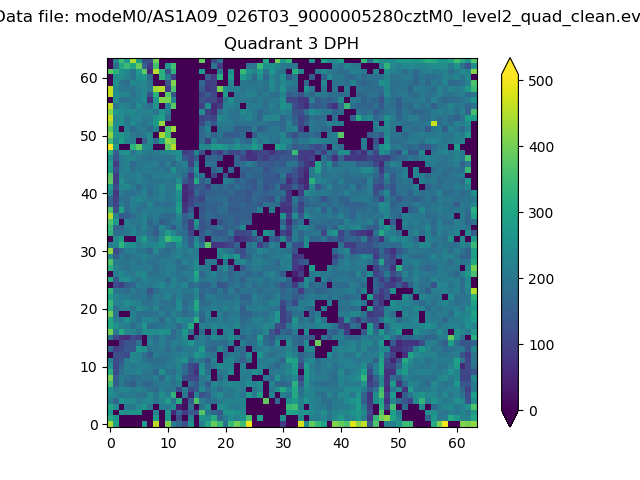 |
 |
Quadrant C |
| Plot type | Count rate plots | Images |
|---|---|---|
| Comparison with Poisson distribution Blue bars denote a histogram of data divided into 1 sec bins. Red curve is a Poisson curve with rate = median count rate of data. |
 |
 |
| Quadrant-wise count rates Data is divided into 100 sec bins |
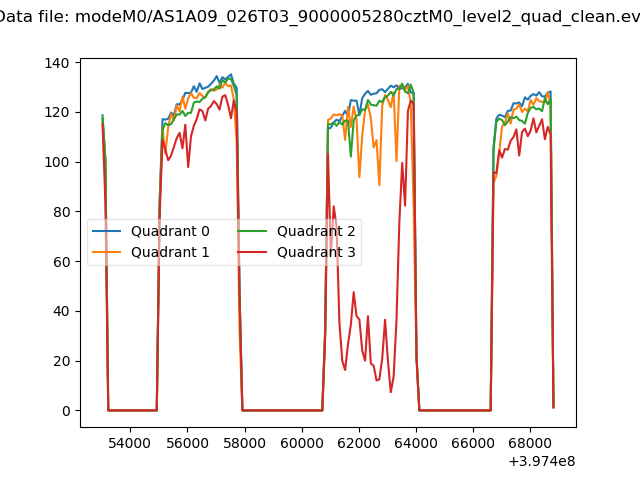 |
|
| Module-wise count rates for Quadrant A Data is divided into 100 sec bins |
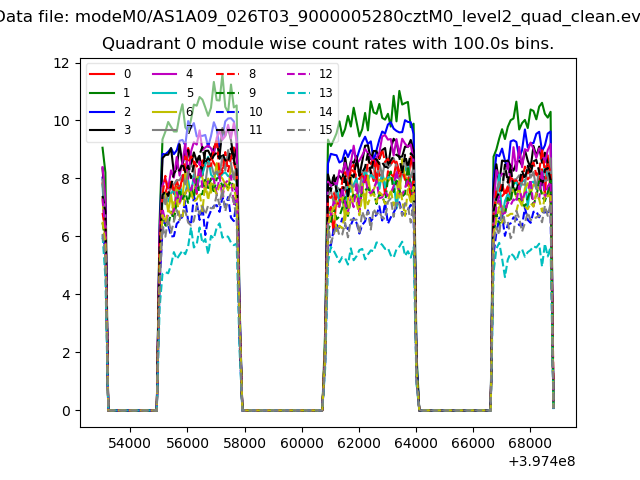 |
 |
| Module-wise count rates for Quadrant B Data is divided into 100 sec bins |
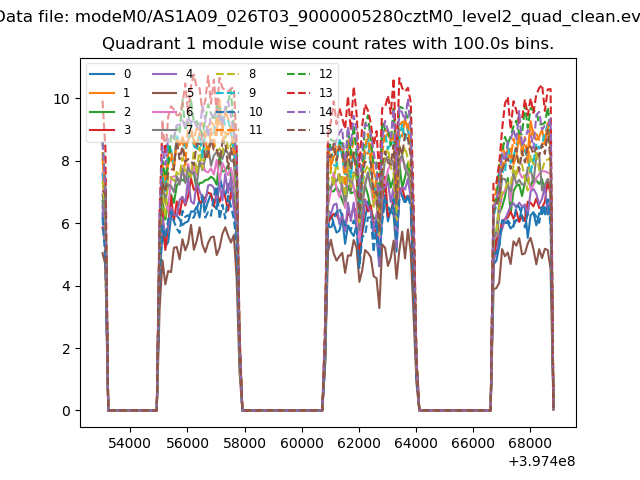 |
 |
| Module-wise count rates for Quadrant C Data is divided into 100 sec bins |
 |
 |
| Module-wise count rates for Quadrant D Data is divided into 100 sec bins |
 |
 |
| Parameter | Plot |
|---|---|
| CZT HV Monitor |  |
| D_VDD | 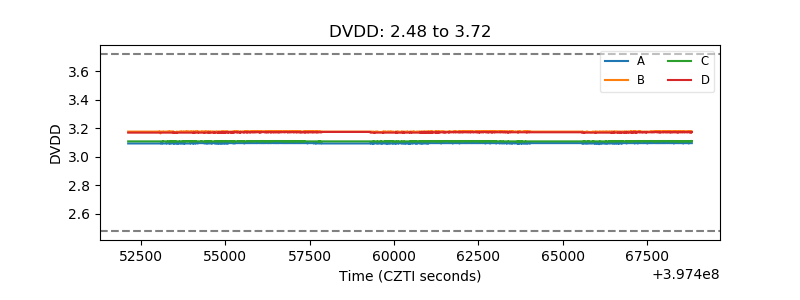 |
| Temperature 1 | 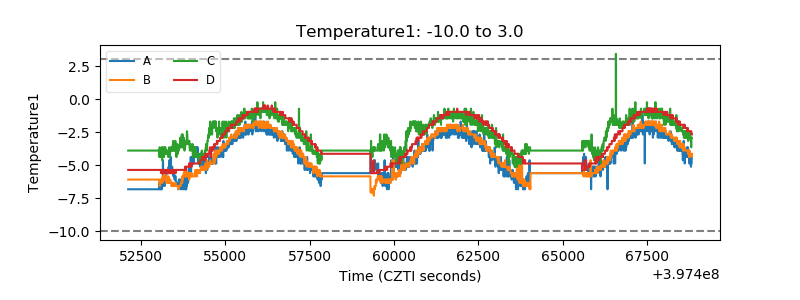 |
| Veto HV Monitor |  |
| Veto LLD |  |
| Alpha Counter |  |
| _CPM_Rate |  |
| CZT Counter |  |
| +2.5 Volts monitor | 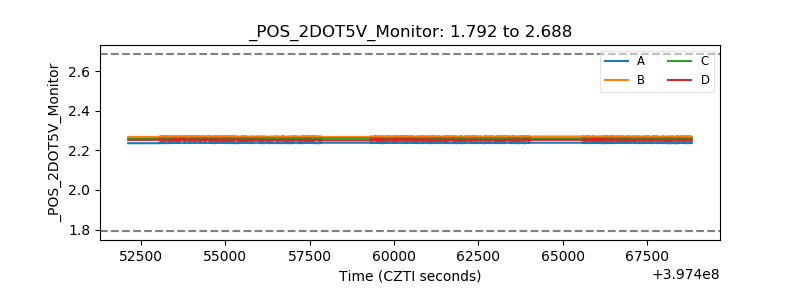 |
| +5 Volts monitor |  |
| _ROLL_ROT | 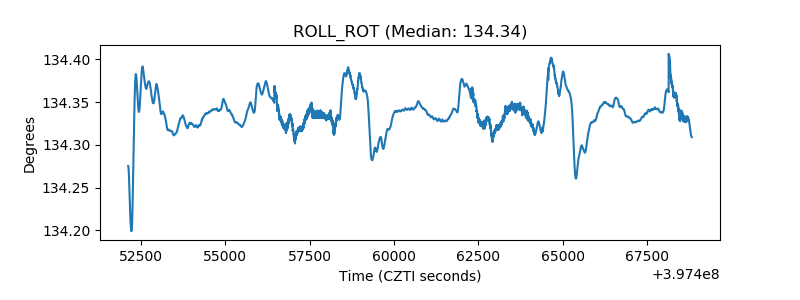 |
| _Roll_DEC | 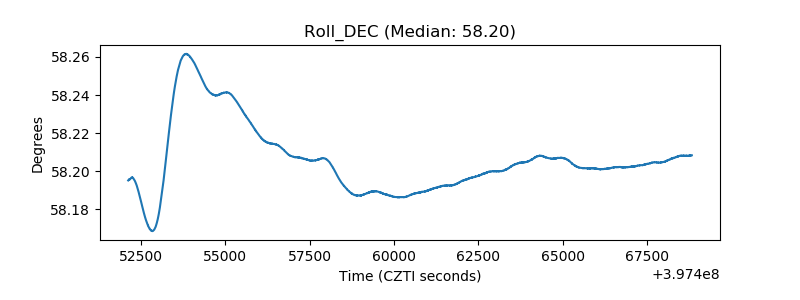 |
| _Roll_RA |  |
| Veto Counter |  |