| Param | Original file | Final file |
|---|---|---|
| Filename | modeM0/AS1A09_038T01_9000005276cztM0_level2_bc.evt | modeM0/AS1A09_038T01_9000005276cztM0_level2_quad_clean.evt |
| Size (bytes) | 285,353,280 | 108,063,360 |
| Size | 272.1 MB | 103.1 MB |
| Events in quadrant A | 1,399,700 | 762,751 |
| Events in quadrant B | 2,321,930 | 722,596 |
| Events in quadrant C | 1,555,059 | 762,912 |
| Events in quadrant D | 2,965,078 | 621,534 |
| Mode M9 | |||
|---|---|---|---|
| Quadrant | BADHDUFLAG | Total packets | Discarded packets |
| A | 0 | 24 | 0 |
| B | 0 | 24 | 0 |
| C | 0 | 24 | 0 |
| D | 0 | 24 | 0 |
| Mode M0 | |||
|---|---|---|---|
| Quadrant | BADHDUFLAG | Total packets | Discarded packets |
| A | 0 | 11859 | 0 |
| B | 0 | 17058 | 0 |
| C | 0 | 12238 | 0 |
| D | 0 | 21344 | 0 |
| Mode SS | |||
|---|---|---|---|
| Quadrant | BADHDUFLAG | Total packets | Discarded packets |
| A | 0 | 120 | 0 |
| B | 0 | 120 | 0 |
| C | 0 | 120 | 0 |
| D | 0 | 120 | 0 |
| Quadrant | Total seconds | Saturated seconds | Saturation percentage |
|---|---|---|---|
| A | 5752 | 6 | 0.104312% |
| B | 5752 | 763 | 13.264951% |
| C | 5752 | 47 | 0.817107% |
| D | 5752 | 1293 | 22.479138% |
Noise dominated data is calculated using 1-second bins in cleaned event files. If a bin has >2000 counts, and if more than 50% of those come from <1% of pixels, then it is considered to be noise-dominated and hence unusable.
| Quadrant | # 1 sec bins | Bins with >0 counts | Bins with >2000 counts | High rate bins dominated by noise | Noise dominated (total time) | Noise dominated (detector-on time) | Marked lightcurve |
|---|---|---|---|---|---|---|---|
| A | 7875 | 5753 | 0 | 0 | 0.00% | 0.00% |  |
| B | 7875 | 5751 | 21 | 21 | 0.27% | 0.37% | 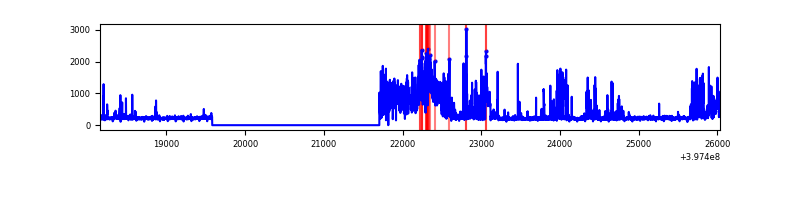 |
| C | 7875 | 5752 | 2 | 2 | 0.03% | 0.03% |  |
| D | 7875 | 5747 | 54 | 54 | 0.69% | 0.94% |  |
Top three noisy pixels from each quadrant. If the there are fewer than three noisy pixels in the level2.evt file, extra rows are filled as -1
| Pixel properties | Quadrant properties | ||||||
|---|---|---|---|---|---|---|---|
| Quadrant | DetID | PixID | Counts | Sigma | Mean | Median | Sigma |
| A | 10 | 83 | 203294 | 2891.19 | 304 | 298 | 70.2 |
| A | 13 | 254 | 7692 | 105.31 | 304 | 298 | 70.2 |
| A | 13 | 6 | 7127 | 97.26 | 304 | 298 | 70.2 |
| B | 5 | 184 | 675022 | 11478.98 | 287 | 282 | 58.8 |
| B | 5 | 172 | 309110 | 5253.92 | 287 | 282 | 58.8 |
| B | 5 | 200 | 74247 | 1258.33 | 287 | 282 | 58.8 |
| C | 15 | 214 | 225229 | 3205.73 | 300 | 299 | 70.2 |
| C | 0 | 10 | 87527 | 1243.19 | 300 | 299 | 70.2 |
| C | 10 | 20 | 40343 | 570.71 | 300 | 299 | 70.2 |
| D | 12 | 17 | 565718 | 8866.91 | 260 | 251 | 63.8 |
| D | 6 | 112 | 477479 | 7483.26 | 260 | 251 | 63.8 |
| D | 2 | 250 | 265959 | 4166.48 | 260 | 251 | 63.8 |
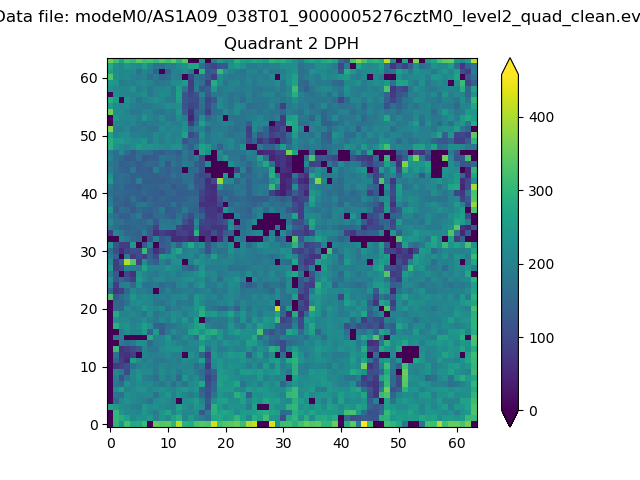
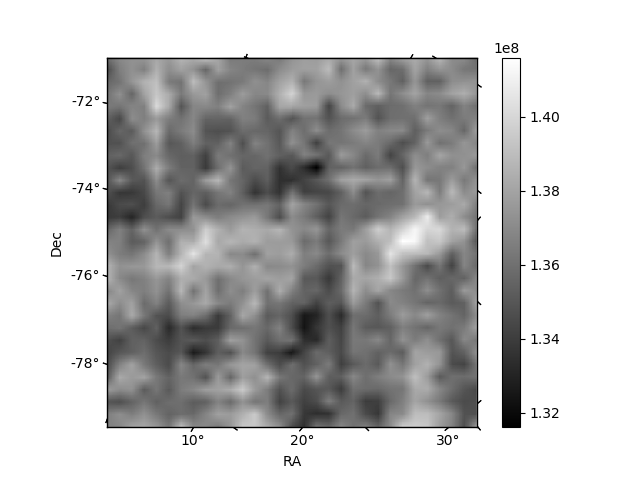
Histogram calculated using DETX and DETY for each event in the final _common_clean file
| Quadrant A |  |
 |
Quadrant B |
|---|---|---|---|
| Quadrant D | 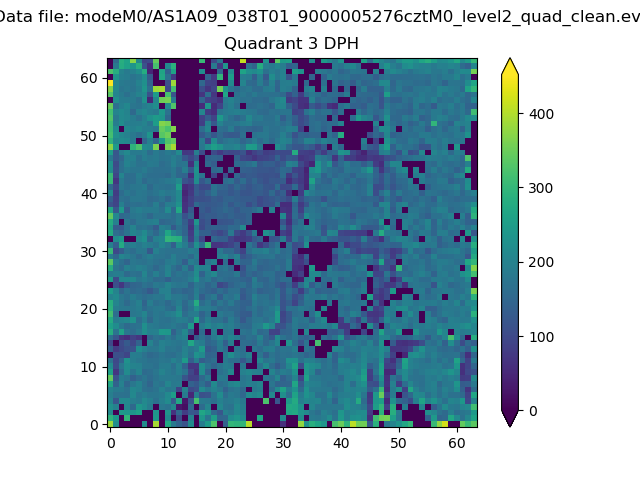 |
 |
Quadrant C |
| Plot type | Count rate plots | Images |
|---|---|---|
| Comparison with Poisson distribution Blue bars denote a histogram of data divided into 1 sec bins. Red curve is a Poisson curve with rate = median count rate of data. |
 |
 |
| Quadrant-wise count rates Data is divided into 100 sec bins |
 |
|
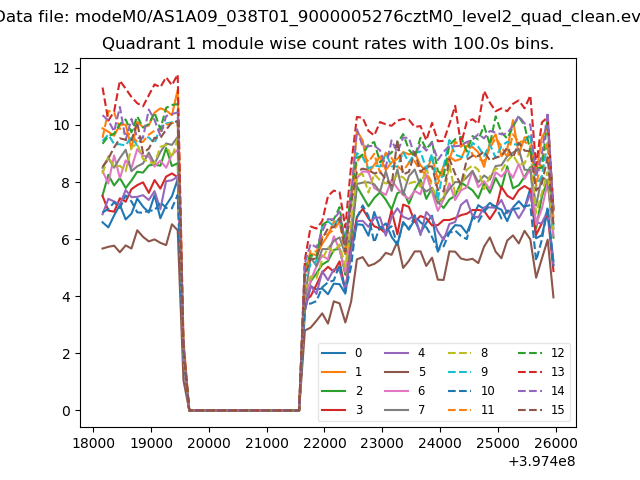
| Module-wise count rates for Quadrant A Data is divided into 100 sec bins |
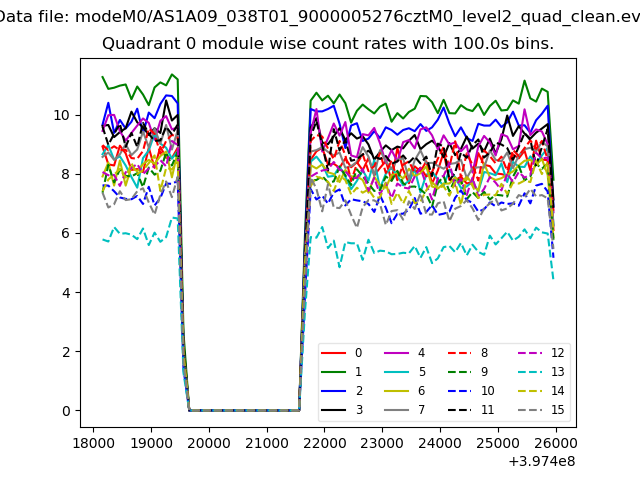 |
 |
| Module-wise count rates for Quadrant B Data is divided into 100 sec bins |
 |
 |
| Module-wise count rates for Quadrant C Data is divided into 100 sec bins |
 |
 |
| Module-wise count rates for Quadrant D Data is divided into 100 sec bins |
 |
 |
| Parameter | Plot |
|---|---|
| CZT HV Monitor |  |
| D_VDD |  |
| Temperature 1 |  |
| Veto HV Monitor |  |
| Veto LLD |  |
| Alpha Counter | 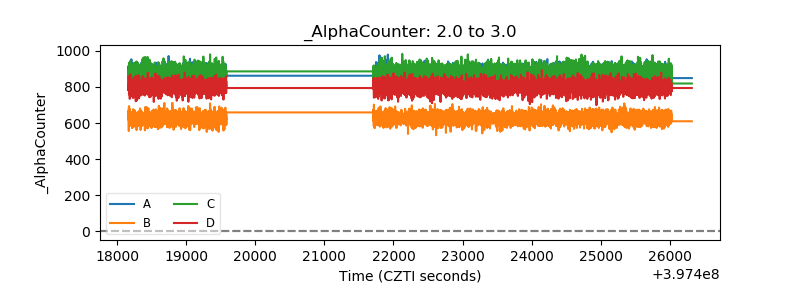 |
| _CPM_Rate |  |
| CZT Counter |  |
| +2.5 Volts monitor |  |
| +5 Volts monitor |  |
| _ROLL_ROT |  |
| _Roll_DEC |  |
| _Roll_RA |  |
| Veto Counter | 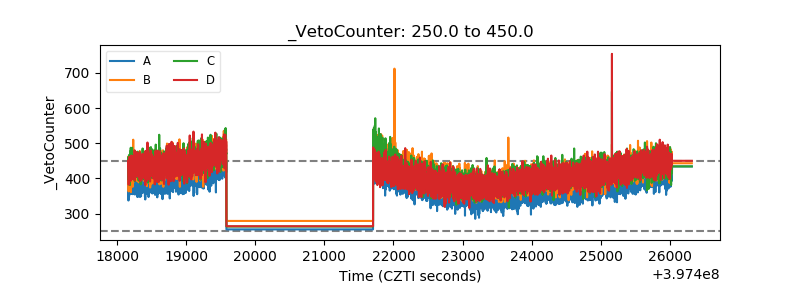 |