| Param | Original file | Final file |
|---|---|---|
| Filename | modeM0/AS1A09_026T06_9000005278cztM0_level2_bc.evt | modeM0/AS1A09_026T06_9000005278cztM0_level2_quad_clean.evt |
| Size (bytes) | 956,168,640 | 229,512,960 |
| Size | 911.9 MB | 218.9 MB |
| Events in quadrant A | 4,794,828 | 1,458,657 |
| Events in quadrant B | 6,788,625 | 1,409,800 |
| Events in quadrant C | 5,705,227 | 1,428,714 |
| Events in quadrant D | 10,340,971 | 1,313,877 |
| Mode M9 | |||
|---|---|---|---|
| Quadrant | BADHDUFLAG | Total packets | Discarded packets |
| A | 0 | 43 | 0 |
| B | 0 | 43 | 0 |
| C | 0 | 43 | 0 |
| D | 0 | 43 | 0 |
| Mode SS | |||
|---|---|---|---|
| Quadrant | BADHDUFLAG | Total packets | Discarded packets |
| A | 0 | 396 | 0 |
| B | 0 | 396 | 0 |
| C | 0 | 396 | 0 |
| D | 0 | 396 | 0 |
| Mode M0 | |||
|---|---|---|---|
| Quadrant | BADHDUFLAG | Total packets | Discarded packets |
| A | 0 | 41084 | 0 |
| B | 0 | 51514 | 0 |
| C | 0 | 43832 | 0 |
| D | 0 | 62556 | 0 |
| Quadrant | Total seconds | Saturated seconds | Saturation percentage |
|---|---|---|---|
| A | 19442 | 41 | 0.210884% |
| B | 19442 | 879 | 4.521140% |
| C | 19442 | 297 | 1.527621% |
| D | 19442 | 1518 | 7.807839% |
Noise dominated data is calculated using 1-second bins in cleaned event files. If a bin has >2000 counts, and if more than 50% of those come from <1% of pixels, then it is considered to be noise-dominated and hence unusable.
| Quadrant | # 1 sec bins | Bins with >0 counts | Bins with >2000 counts | High rate bins dominated by noise | Noise dominated (total time) | Noise dominated (detector-on time) | Marked lightcurve |
|---|---|---|---|---|---|---|---|
| A | 23621 | 19445 | 4 | 4 | 0.02% | 0.02% | 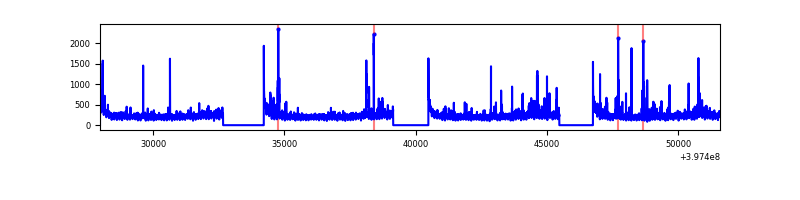 |
| B | 23620 | 19438 | 41 | 41 | 0.17% | 0.21% |  |
| C | 23620 | 19441 | 74 | 74 | 0.31% | 0.38% |  |
| D | 23619 | 19437 | 227 | 227 | 0.96% | 1.17% |  |
Top three noisy pixels from each quadrant. If the there are fewer than three noisy pixels in the level2.evt file, extra rows are filled as -1
| Pixel properties | Quadrant properties | ||||||
|---|---|---|---|---|---|---|---|
| Quadrant | DetID | PixID | Counts | Sigma | Mean | Median | Sigma |
| A | 10 | 83 | 741090 | 3389.59 | 968 | 950 | 218.4 |
| A | 9 | 143 | 160854 | 732.31 | 968 | 950 | 218.4 |
| A | 13 | 6 | 32727 | 145.53 | 968 | 950 | 218.4 |
| B | 5 | 184 | 1047974 | 5543.53 | 948 | 927 | 188.9 |
| B | 5 | 172 | 986731 | 5219.28 | 948 | 927 | 188.9 |
| B | 0 | 190 | 263560 | 1390.5 | 948 | 927 | 188.9 |
| C | 15 | 214 | 774294 | 3479.66 | 950 | 942 | 222.2 |
| C | 14 | 254 | 551685 | 2478.04 | 950 | 942 | 222.2 |
| C | 0 | 207 | 250040 | 1120.8 | 950 | 942 | 222.2 |
| D | 1 | 52 | 1556940 | 6861.6 | 934 | 903 | 226.8 |
| D | 12 | 235 | 1124145 | 4953.12 | 934 | 903 | 226.8 |
| D | 6 | 112 | 1092177 | 4812.15 | 934 | 903 | 226.8 |
Histogram calculated using DETX and DETY for each event in the final _common_clean file
| Quadrant A |  |
 |
Quadrant B |
|---|---|---|---|
| Quadrant D |  |
 |
Quadrant C |
| Plot type | Count rate plots | Images |
|---|---|---|
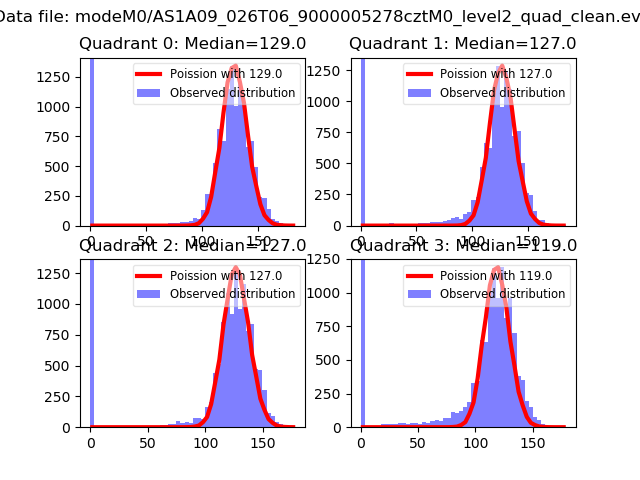
| Comparison with Poisson distribution Blue bars denote a histogram of data divided into 1 sec bins. Red curve is a Poisson curve with rate = median count rate of data. |
 |
 |
| Quadrant-wise count rates Data is divided into 100 sec bins |
 |
|
| Module-wise count rates for Quadrant A Data is divided into 100 sec bins |
 |
 |
| Module-wise count rates for Quadrant B Data is divided into 100 sec bins |
 |
 |
| Module-wise count rates for Quadrant C Data is divided into 100 sec bins |
 |
 |
| Module-wise count rates for Quadrant D Data is divided into 100 sec bins |
 |
 |
| Parameter | Plot |
|---|---|
| CZT HV Monitor |  |
| D_VDD |  |
| Temperature 1 |  |
| Veto HV Monitor |  |
| Veto LLD |  |
| Alpha Counter | 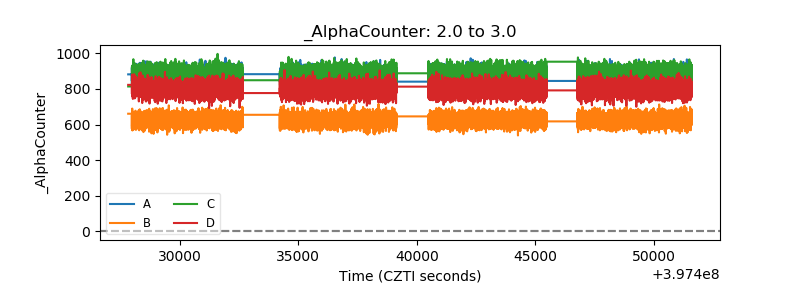 |
| _CPM_Rate |  |
| CZT Counter |  |
| +2.5 Volts monitor |  |
| +5 Volts monitor |  |
| _ROLL_ROT |  |
| _Roll_DEC |  |
| _Roll_RA |  |
| Veto Counter | 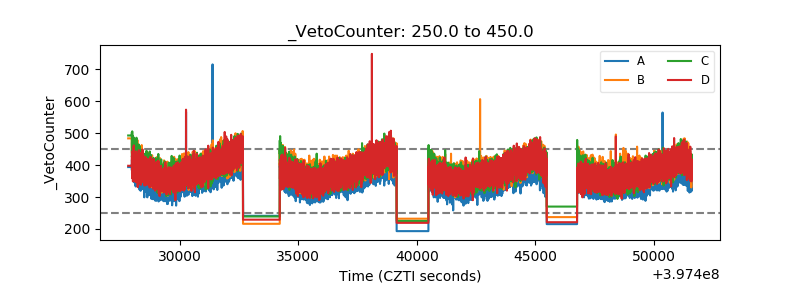 |