| Param | Original file | Final file |
|---|---|---|
| Filename | modeM0/AS1T05_045T01_9000005268cztM0_level2_bc.evt | modeM0/AS1T05_045T01_9000005268cztM0_level2_quad_clean.evt |
| Size (bytes) | 319,616,640 | 62,280,000 |
| Size | 304.8 MB | 59.4 MB |
| Events in quadrant A | 1,451,990 | 375,118 |
| Events in quadrant B | 2,279,020 | 371,927 |
| Events in quadrant C | 2,359,641 | 366,672 |
| Events in quadrant D | 3,152,497 | 331,294 |
| Mode M9 | |||
|---|---|---|---|
| Quadrant | BADHDUFLAG | Total packets | Discarded packets |
| A | 0 | 18 | 0 |
| B | 0 | 18 | 0 |
| C | 0 | 18 | 0 |
| D | 0 | 18 | 0 |
| Mode M0 | |||
|---|---|---|---|
| Quadrant | BADHDUFLAG | Total packets | Discarded packets |
| A | 0 | 12948 | 0 |
| B | 0 | 16696 | 0 |
| C | 0 | 15924 | 0 |
| D | 0 | 19697 | 0 |
| Mode SS | |||
|---|---|---|---|
| Quadrant | BADHDUFLAG | Total packets | Discarded packets |
| A | 0 | 128 | 0 |
| B | 0 | 128 | 0 |
| C | 0 | 128 | 0 |
| D | 0 | 128 | 0 |
| Quadrant | Total seconds | Saturated seconds | Saturation percentage |
|---|---|---|---|
| A | 6310 | 8 | 0.126783% |
| B | 6310 | 355 | 5.625990% |
| C | 6310 | 58 | 0.919176% |
| D | 6310 | 415 | 6.576862% |
Noise dominated data is calculated using 1-second bins in cleaned event files. If a bin has >2000 counts, and if more than 50% of those come from <1% of pixels, then it is considered to be noise-dominated and hence unusable.
| Quadrant | # 1 sec bins | Bins with >0 counts | Bins with >2000 counts | High rate bins dominated by noise | Noise dominated (total time) | Noise dominated (detector-on time) | Marked lightcurve |
|---|---|---|---|---|---|---|---|
| A | 7652 | 6311 | 0 | 0 | 0.00% | 0.00% | 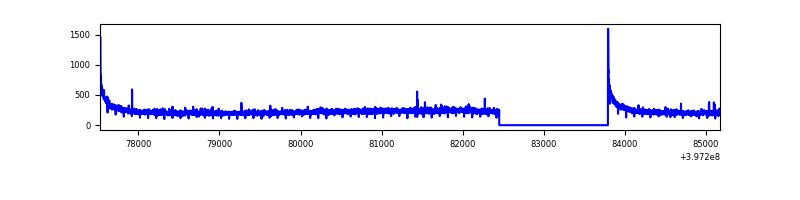 |
| B | 7651 | 6310 | 61 | 61 | 0.80% | 0.97% |  |
| C | 7651 | 6309 | 6 | 6 | 0.08% | 0.10% | 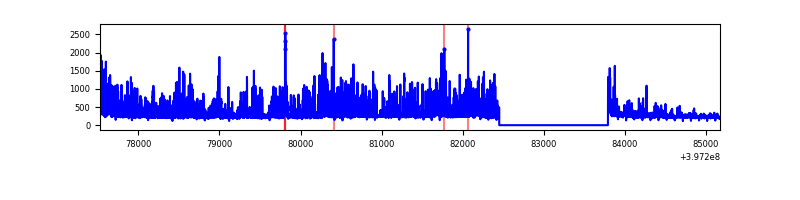 |
| D | 7651 | 6308 | 49 | 49 | 0.64% | 0.78% |  |
Top three noisy pixels from each quadrant. If the there are fewer than three noisy pixels in the level2.evt file, extra rows are filled as -1
| Pixel properties | Quadrant properties | ||||||
|---|---|---|---|---|---|---|---|
| Quadrant | DetID | PixID | Counts | Sigma | Mean | Median | Sigma |
| A | 10 | 83 | 248442 | 3541.67 | 307 | 301 | 70.1 |
| A | 13 | 6 | 11819 | 164.39 | 307 | 301 | 70.1 |
| A | 13 | 254 | 9437 | 130.4 | 307 | 301 | 70.1 |
| B | 5 | 172 | 799828 | 12747.57 | 303 | 295 | 62.7 |
| B | 5 | 184 | 142004 | 2259.38 | 303 | 295 | 62.7 |
| B | 5 | 255 | 31987 | 505.29 | 303 | 295 | 62.7 |
| C | 0 | 10 | 697459 | 9802.22 | 301 | 297 | 71.1 |
| C | 15 | 214 | 262646 | 3688.67 | 301 | 297 | 71.1 |
| C | 14 | 254 | 168401 | 2363.57 | 301 | 297 | 71.1 |
| D | 13 | 249 | 789049 | 10934.61 | 293 | 283 | 72.1 |
| D | 2 | 249 | 421248 | 5835.81 | 293 | 283 | 72.1 |
| D | 2 | 250 | 408452 | 5658.42 | 293 | 283 | 72.1 |
Histogram calculated using DETX and DETY for each event in the final _common_clean file
| Quadrant A |  |
 |
Quadrant B |
|---|---|---|---|
| Quadrant D |  |
 |
Quadrant C |
| Plot type | Count rate plots | Images |
|---|---|---|
| Comparison with Poisson distribution Blue bars denote a histogram of data divided into 1 sec bins. Red curve is a Poisson curve with rate = median count rate of data. |
 |
 |
| Quadrant-wise count rates Data is divided into 100 sec bins |
 |
|
| Module-wise count rates for Quadrant A Data is divided into 100 sec bins |
 |
 |
| Module-wise count rates for Quadrant B Data is divided into 100 sec bins |
 |
 |
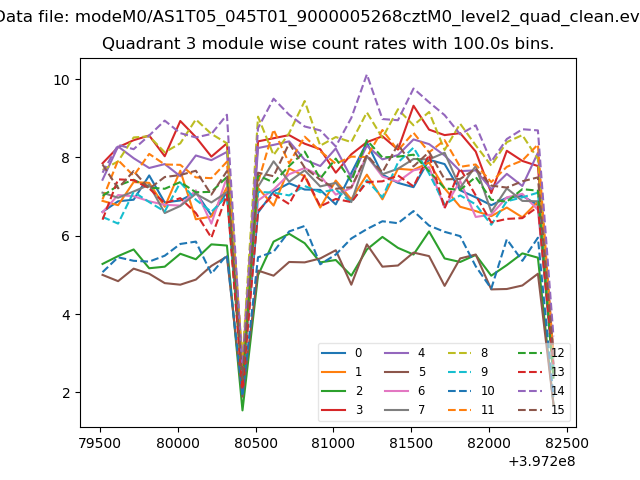
| Module-wise count rates for Quadrant C Data is divided into 100 sec bins |
 |
 |
| Module-wise count rates for Quadrant D Data is divided into 100 sec bins |
 |
 |
| Parameter | Plot |
|---|---|
| CZT HV Monitor |  |
| D_VDD |  |
| Temperature 1 |  |
| Veto HV Monitor |  |
| Veto LLD |  |
| Alpha Counter |  |
| _CPM_Rate |  |
| CZT Counter |  |
| +2.5 Volts monitor |  |
| +5 Volts monitor |  |
| _ROLL_ROT |  |
| _Roll_DEC |  |
| _Roll_RA |  |
| Veto Counter |  |