| Param | Original file | Final file |
|---|---|---|
| Filename | modeM0/AS1T05_044T01_9000005270cztM0_level2_bc.evt | modeM0/AS1T05_044T01_9000005270cztM0_level2_quad_clean.evt |
| Size (bytes) | 1,001,615,040 | 280,437,120 |
| Size | 955.2 MB | 267.4 MB |
| Events in quadrant A | 5,348,856 | 1,876,352 |
| Events in quadrant B | 8,230,520 | 1,810,885 |
| Events in quadrant C | 6,750,421 | 1,801,197 |
| Events in quadrant D | 8,700,313 | 1,688,770 |
| Mode M0 | |||
|---|---|---|---|
| Quadrant | BADHDUFLAG | Total packets | Discarded packets |
| A | 0 | 42280 | 0 |
| B | 0 | 55136 | 0 |
| C | 0 | 46848 | 0 |
| D | 0 | 56023 | 0 |
| Mode SS | |||
|---|---|---|---|
| Quadrant | BADHDUFLAG | Total packets | Discarded packets |
| A | 0 | 394 | 0 |
| B | 0 | 394 | 0 |
| C | 0 | 394 | 0 |
| D | 0 | 394 | 0 |
| Mode M9 | |||
|---|---|---|---|
| Quadrant | BADHDUFLAG | Total packets | Discarded packets |
| A | 0 | 88 | 0 |
| B | 0 | 86 | 0 |
| C | 0 | 89 | 0 |
| D | 0 | 88 | 0 |
| Quadrant | Total seconds | Saturated seconds | Saturation percentage |
|---|---|---|---|
| A | 19106 | 51 | 0.266932% |
| B | 19107 | 1096 | 5.736118% |
| C | 19097 | 394 | 2.063151% |
| D | 19096 | 950 | 4.974864% |
Noise dominated data is calculated using 1-second bins in cleaned event files. If a bin has >2000 counts, and if more than 50% of those come from <1% of pixels, then it is considered to be noise-dominated and hence unusable.
| Quadrant | # 1 sec bins | Bins with >0 counts | Bins with >2000 counts | High rate bins dominated by noise | Noise dominated (total time) | Noise dominated (detector-on time) | Marked lightcurve |
|---|---|---|---|---|---|---|---|
| A | 28122 | 19120 | 3 | 3 | 0.01% | 0.02% | 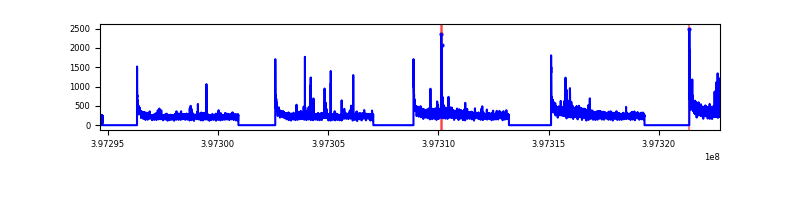 |
| B | 28122 | 19118 | 242 | 242 | 0.86% | 1.27% |  |
| C | 28122 | 19111 | 106 | 106 | 0.38% | 0.55% |  |
| D | 28122 | 19110 | 103 | 103 | 0.37% | 0.54% |  |
Top three noisy pixels from each quadrant. If the there are fewer than three noisy pixels in the level2.evt file, extra rows are filled as -1
| Pixel properties | Quadrant properties | ||||||
|---|---|---|---|---|---|---|---|
| Quadrant | DetID | PixID | Counts | Sigma | Mean | Median | Sigma |
| A | 10 | 83 | 804689 | 3490.34 | 1034 | 1018 | 230.3 |
| A | 11 | 254 | 401256 | 1738.23 | 1034 | 1018 | 230.3 |
| A | 13 | 248 | 62877 | 268.65 | 1034 | 1018 | 230.3 |
| B | 0 | 182 | 887723 | 4407.23 | 1007 | 986 | 201.2 |
| B | 5 | 184 | 675229 | 3351.1 | 1007 | 986 | 201.2 |
| B | 0 | 213 | 576240 | 2859.11 | 1007 | 986 | 201.2 |
| C | 15 | 214 | 776073 | 3410.91 | 985 | 982 | 227.2 |
| C | 0 | 207 | 590307 | 2593.42 | 985 | 982 | 227.2 |
| C | 0 | 10 | 470481 | 2066.1 | 985 | 982 | 227.2 |
| D | 12 | 235 | 1461623 | 6198.86 | 983 | 955 | 235.6 |
| D | 2 | 250 | 991519 | 4203.81 | 983 | 955 | 235.6 |
| D | 2 | 249 | 369405 | 1563.65 | 983 | 955 | 235.6 |
Histogram calculated using DETX and DETY for each event in the final _common_clean file
| Quadrant A | 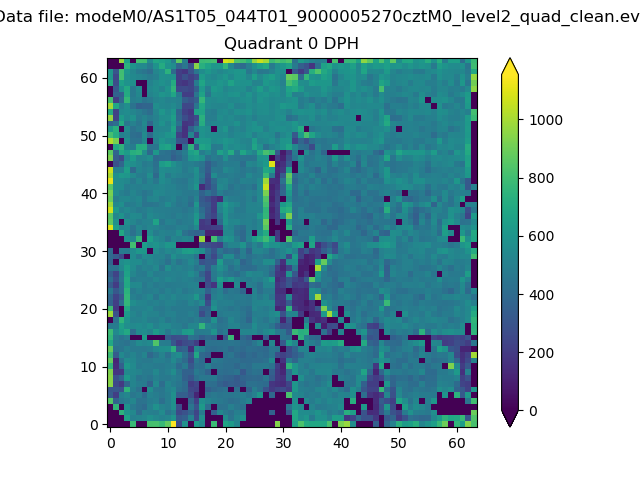 |
 |
Quadrant B |
|---|---|---|---|
| Quadrant D |  |
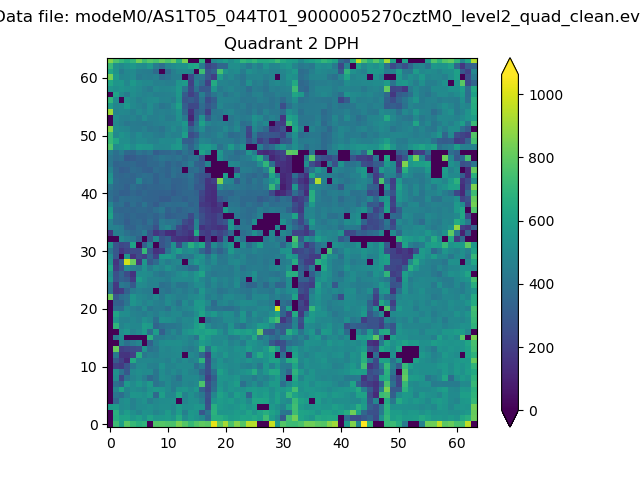 |
Quadrant C |
| Plot type | Count rate plots | Images |
|---|---|---|
| Comparison with Poisson distribution Blue bars denote a histogram of data divided into 1 sec bins. Red curve is a Poisson curve with rate = median count rate of data. |
 |
 |
| Quadrant-wise count rates Data is divided into 100 sec bins |
 |
|
| Module-wise count rates for Quadrant A Data is divided into 100 sec bins |
 |
 |
| Module-wise count rates for Quadrant B Data is divided into 100 sec bins |
 |
 |
| Module-wise count rates for Quadrant C Data is divided into 100 sec bins |
 |
 |
| Module-wise count rates for Quadrant D Data is divided into 100 sec bins |
 |
 |
| Parameter | Plot |
|---|---|
| CZT HV Monitor |  |
| D_VDD |  |
| Temperature 1 |  |
| Veto HV Monitor |  |
| Veto LLD |  |
| Alpha Counter |  |
| _CPM_Rate |  |
| CZT Counter |  |
| +2.5 Volts monitor |  |
| +5 Volts monitor |  |
| _ROLL_ROT |  |
| _Roll_DEC |  |
| _Roll_RA | 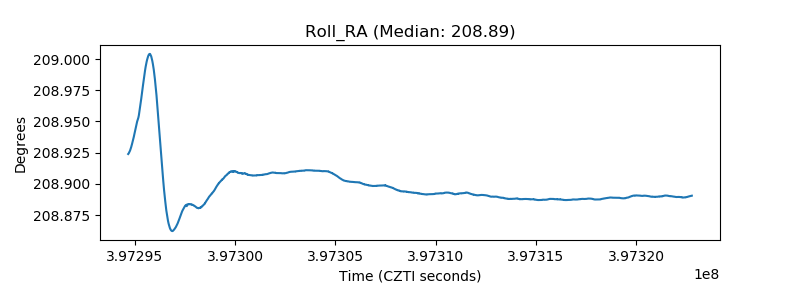 |
| Veto Counter |  |